Custom Dashboard
A Custom Dashboard for a Single Ticket Type is a specialized view that provides focused insights and analytics related to a specific category of tickets. This ensures that teams can monitor, manage, and optimize the handling of particular types of tickets effectively.
Definition
A Custom Dashboard for a Single Ticket Type is a user-defined interface that tracks and displays real-time and historical data for a specific ticket type (e.g., Incidents, Service Requests, Change Requests, Complaints). It allows agents and managers to analyze performance, track resolutions, and ensure SLA compliance for that ticket type.
Key Features & Components
-
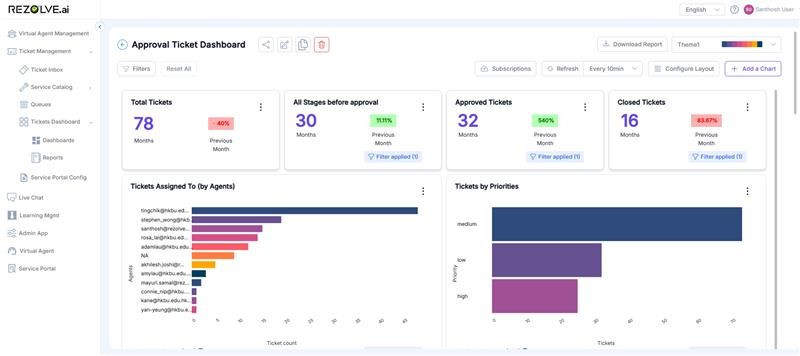
Ticket Overview Panel a. Total number of open, in-progress, and closed tickets of the selected type b. Breakdown by priority (Low, Medium, High, Critical)
-
Agent Performance Metrics a. Assigned vs. resolved tickets per agent b. First Contact Resolution (FCR) rate c. Average handling and resolution time d. Escalation rate for the specific ticket type
-
SLA Compliance Tracking a. Percentage of tickets resolved within SLA b. Alerts for SLA breaches and overdue tickets
-
Customer Satisfaction (CSAT) & Feedback a. CSAT ratings specific to the ticket type b. Common feedback trends or issues raised by customers
-
Trends & Analytics a. Volume trends (daily, weekly, monthly) b. Common categories/subcategories within the ticket type c. Root cause analysis for frequently occurring issues
-
Filtering & Customization Options a. Date range selection b. Filter by priority, assignee, or status c. Custom widgets to highlight key insights relevant to the business
Benefits of a Custom Dashboard for a Single Ticket Type
- Focused analysis on a specific category of tickets
- Improved resolution time through targeted monitoring
- Helps in identifying recurring issues and improving processes
- Ensures SLA adherence and boosts customer satisfaction
- Customizable to align with business goals and priorities
Creating a Custom Dashboard
Step-by-Step Process
-
Select Dashboard Type
- Navigate to the Dashboard section
- Click on "Create New Dashboard"
- Select "Single Ticket Type Dashboard" from the options
-
Choose Ticket Type
- Select the specific ticket type you want to monitor (Incidents, Service Requests, etc.)
- Define the scope of data to include (time period, departments, etc.)
-
Select Widgets
- Choose from available widgets based on your monitoring needs
- Arrange widgets in the desired layout
- Configure each widget with specific parameters
-
Set Refresh Rate
- Define how frequently the dashboard should update
- Options typically include real-time, hourly, or daily updates
-
Configure Alerts
- Set up notifications for critical thresholds
- Define alert recipients and delivery methods
-
Save and Share
- Name and save your custom dashboard
- Set permissions for viewing and editing
- Share with relevant team members
Customization Options
- Layout Customization: Drag and drop widgets to create your ideal view
- Color Coding: Highlight critical metrics with custom color schemes
- Export Options: Schedule regular exports or generate on-demand reports
- Saved Views: Create and save multiple configurations for different purposes