Agent Performance
The Agent Performance section in a ticketing dashboard helps track and evaluate the efficiency and effectiveness of support agents. It provides key insights into individual and team productivity, helping managers identify strengths and areas for improvement.
Key Metrics for Agent Performance
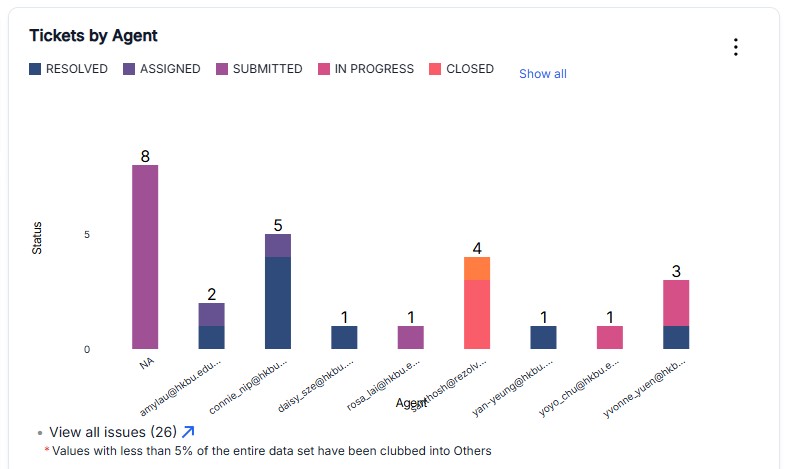
- Tickets Assigned – Total number of tickets assigned to an agent within a specific timeframe.
- Tickets Resolved – Number of tickets successfully closed by the agent.
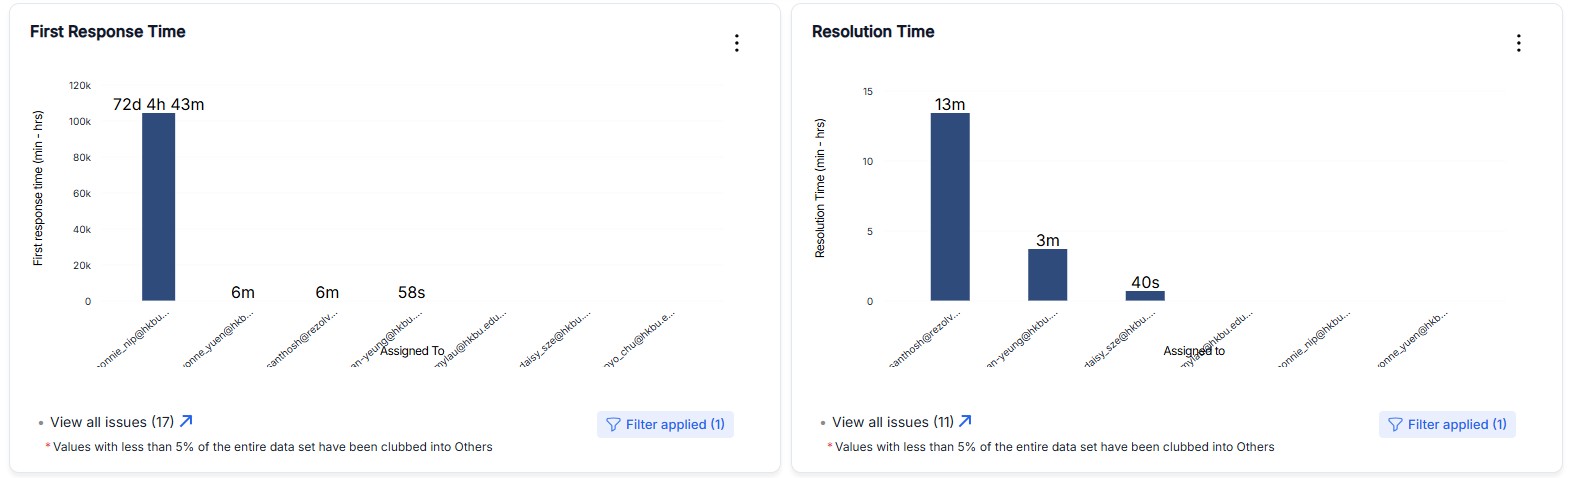
- Average Resolution Time – The average time taken by an agent to resolve tickets.
- Response Time – The time taken by the agent to respond to a ticket after it has been created.
- SLA Compliance – Percentage of tickets resolved within the defined Service Level Agreement timeframes.
- Customer Satisfaction – Ratings and feedback provided by customers for the agent's service.
- First Contact Resolution Rate – Percentage of tickets resolved during the first interaction.
Individual Agent View
The individual agent view provides detailed performance metrics for a specific agent, including:
- Historical performance trends
- Comparison against team averages
- Workload distribution
- Ticket complexity handling
- Areas of expertise based on ticket categories
Team Comparison View
The team comparison view allows managers to:
- Compare performance across different agents
- Identify top performers and those who may need additional support
- Analyze team capacity and workload balance
- Track team-wide trends and patterns