Queue Performance
The Queue Performance dashboard provides an overview of the distribution of tickets across different queues. This dashboard helps managers and administrators monitor workload distribution, identify bottlenecks, and optimize resource allocation across support teams.
Key Benefits
1. Workload Distribution & Resource Allocation
- Helps IT managers balance ticket load among different teams
- Prevents overloading a specific team while others remain underutilized
2. Ticket Prioritization & SLA Compliance
- Identifies high-priority queues that require urgent attention
- Ensures teams meet Service Level Agreements (SLAs) by tracking response/resolution times
3. Identifying Bottlenecks & Backlogs
- Pinpoints queues where tickets are accumulating, indicating delays or inefficiencies
- Helps in identifying if certain types of issues are taking longer to resolve
4. Performance Benchmarking & Process Improvement
- Allows teams to track their efficiency over time by comparing queue performance metrics
- Provides insights for process automation or workflow optimization to speed up ticket handling
5. Enhancing Customer Satisfaction
- Faster ticket resolution means improved end-user experience
- Reduces wait times and ensures issues are handled by the right team
6. Data-Driven Decision Making
- Helps management allocate resources effectively based on queue trends
- Supports automation initiatives by identifying repetitive tasks that can be handled with AI or workflows
Key Metrics in Queue Performance
- Ticket Volume – Number of tickets assigned to each queue
- Resolution Time – How long it takes to resolve tickets in each queue
- First Response Time (FRT) – Time taken to provide an initial response
- Reassignment Rate – How often tickets are moved between queues (indicating misclassification)
- SLA Compliance – Percentage of tickets resolved within agreed service levels
Dashboard Components
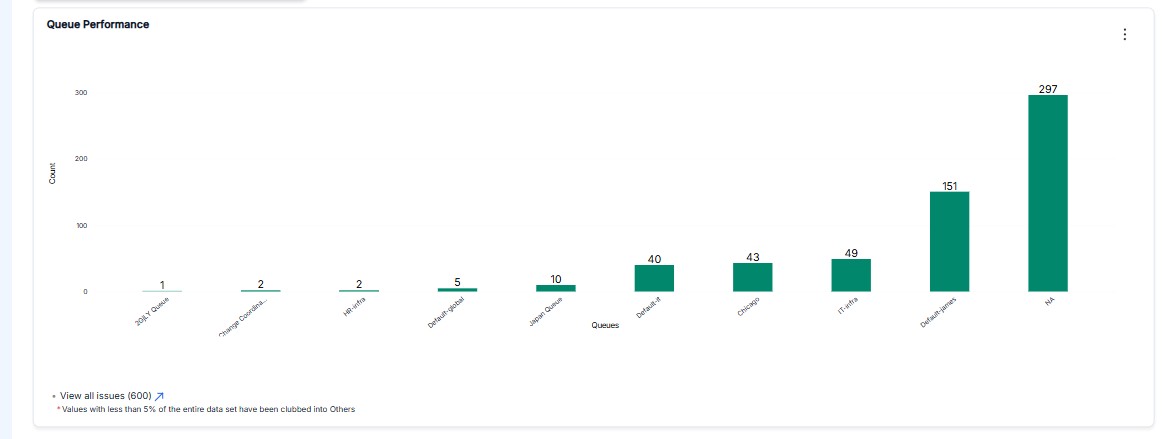
Queue Distribution Chart
A visual representation of how tickets are distributed across different queues, typically displayed as a bar chart or pie chart.
Queue Performance Comparison
Side-by-side comparison of key metrics across different queues, helping identify high-performing and underperforming queues.
Trend Analysis
Historical data showing queue performance over time, useful for identifying patterns and predicting future workload.
SLA Compliance by Queue
Visual indicators showing which queues are meeting their SLA targets and which ones need attention.
Using the Queue Performance Dashboard
For Managers
- Monitor team workload and redistribute resources as needed
- Identify training needs based on queue performance metrics
- Make data-driven decisions about team structure and resource allocation
For Administrators
- Identify configuration issues in queue setup
- Optimize routing rules based on queue performance
- Adjust SLA targets based on historical performance data
For Team Leads
- Track team performance against SLA targets
- Identify bottlenecks in specific queues
- Prioritize work based on queue backlogs and urgency