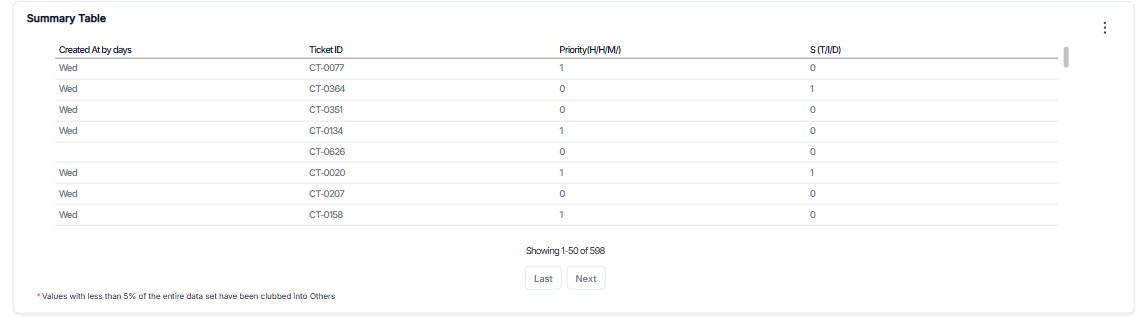
Summary Table
Summary Tables help you create powerful data snapshots by aggregating and grouping information in meaningful ways. Whether you're tracking incidents by priorities, analyzing tickets by statuses, or summarizing any dataset, Summary Tables can transform raw data into actionable insights.
What You Can Do
- Aggregate data using functions like Count, Sum, Average, Min, Max, and Percentage
- Group information by time periods, categories, or any other field
- Create custom aliases for cleaner, more readable column names
- Build multi-dimensional summaries with multiple aggregation and grouping criteria
Key Components
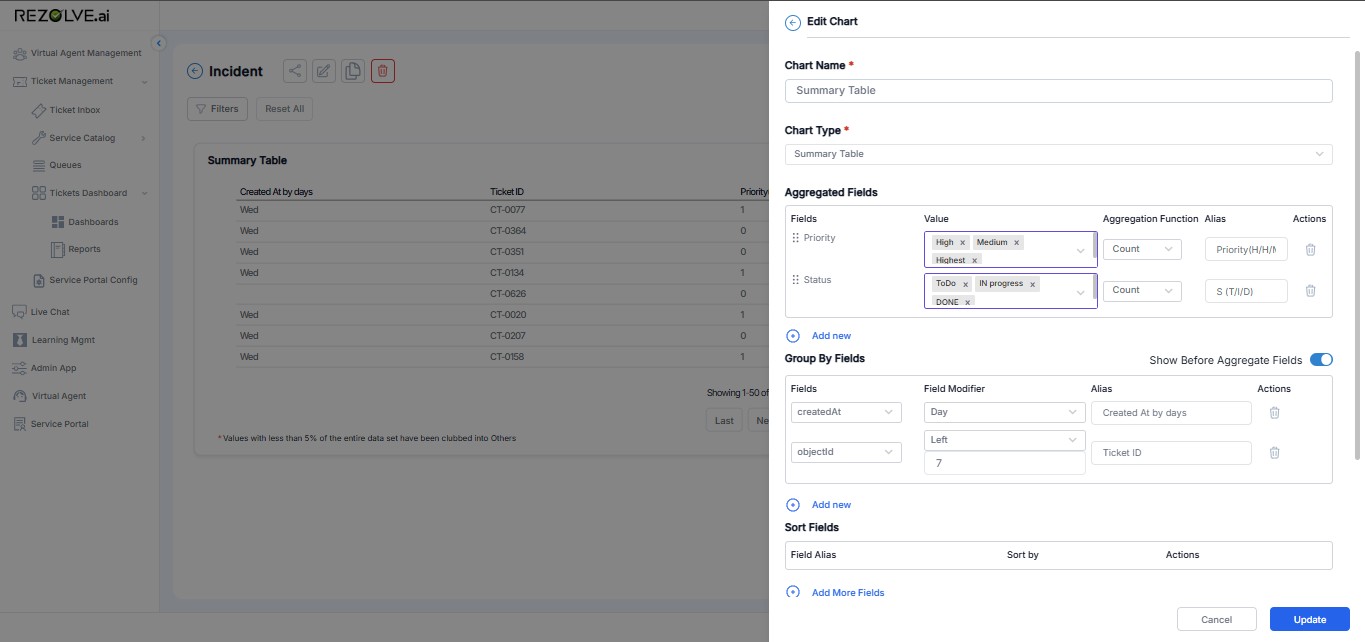
1) Aggregated Fields
These are the metrics you want to calculate from your data.
How it works:
- Select a Field - Choose what data you want to aggregate (e.g., Priority, Status, Category)
- Choose an Aggregation Function - Pick how to calculate your metric:
- Count - How many records match
- Sum - Add up numerical values
- Average - Calculate the mean
- Percentage - Calculate the percentage corresponding to the entire data set
- Min/Max - Find lowest or highest values
- Add an Alias - Give your column a friendly name (e.g., "Total Tickets" instead of "Priority_Count")
Example: Count all incidents by priority level to see "High Priority Issues: 15"
2) Group By Fields
These determine how your data gets organized and broken down.
How it works:
- Select a Field - Choose how to group your data (e.g., Created Date, Status, Department)
- Choose a Field Modifier - For dates, pick the grouping level:
- Day - Group by individual days
- Week - Group by weeks
- Month - Group by months
- Add an Alias - Create a clear column header
Example: Group incidents by "Created At (Day)" to see daily breakdowns
Building Your Summary Table
Step 1: Add Aggregated Fields
- Click "Add new" in the Aggregated Fields section
- Select the field you want to measure
- Choose your aggregation function
- Optionally enter an alias name
- Repeat for additional metrics
Step 2: Add Group By Fields
- Click "Add new" in the Group By Fields section
- Select how you want to organize your data
- For date fields, choose the appropriate time grouping
- Optionally add a descriptive alias
- Add more grouping levels as needed
Step 3: Configure Display Options
- Show Before Aggregate Fields - Toggle to control column ordering
- Sort Fields - Add sorting rules to organize your results
Best Practices
Choose Meaningful Aggregations
- Use Count for frequency analysis ("How many tickets per day?")
- Use Sum for totals ("Total revenue by region")
- Use Average for performance metrics ("Average resolution time")
Group Strategically
- Time-based grouping reveals trends and patterns
- Category grouping shows distribution across different segments
- Multi-level grouping creates detailed breakdowns
Use Clear Aliases
- Replace technical field names with business-friendly terms
- Example: "createdAt_day" → "Date Created"
- Example: "priority_count" → "Number of Tickets"
Tips for Success
-
Start simple with one aggregation and one grouping, then add complexity
-
Preview your data regularly to ensure the summary makes sense
-
Use aliases that your stakeholders will immediately understand
-
Consider your audience when choosing time groupings (daily vs monthly vs quarterly)
-
Keep It Focused: Include only the most relevant columns to avoid information overload
-
Consistent Grouping: Maintain consistent grouping criteria for easier trend analysis
-
Regular Updates: Refresh data regularly to ensure current information
-
Export Options: Configure export settings for sharing reports with stakeholders
-
Saved Views: Create and save different table configurations for various analysis needs