Log Time Chart
The purpose of the Log Time Chart is to visually represent and analyze the time spent on tickets by tracking the "Log Time" metric. It helps in monitoring total time expenditure (Sum), ticket volume (Count), average time per ticket (Average), and the efficiency or velocity of the log time actor (Average Formula: 3600 / Average, indicating tickets completed per hour).
Configuration
Single and Multi Configuration
-
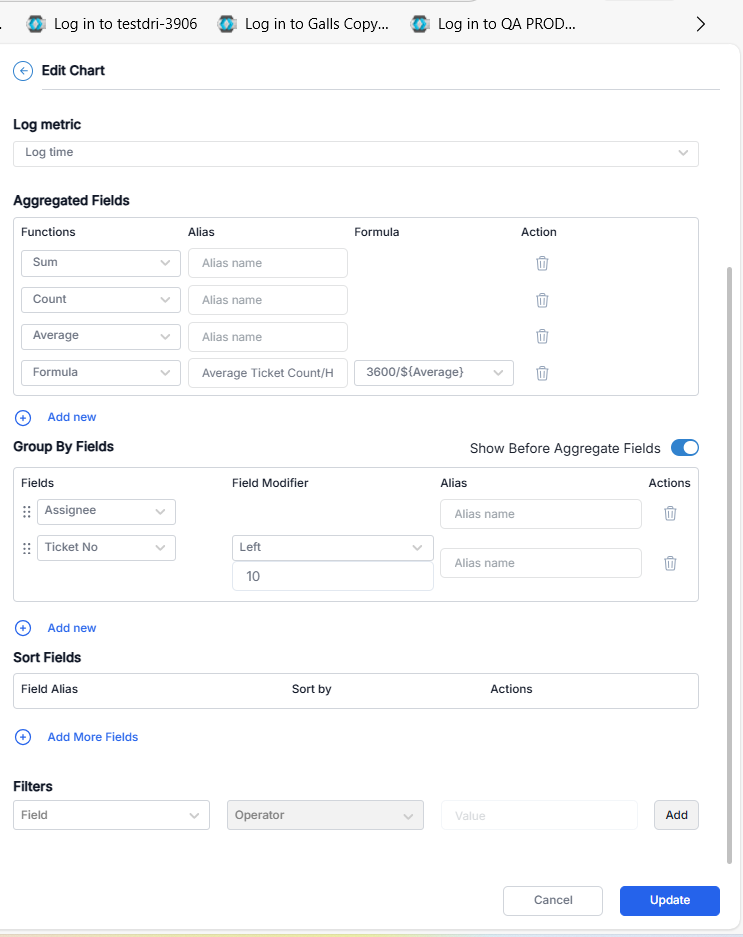
Chart Name: Name the chart "Log Time Chart" to clearly identify its purpose within the dashboard.
-
Chart Time: Set the chart time to "Log Time" to reflect the specific time metric being analyzed.
-
Log Metric Field: Configure the log metric field to display "Log Time" as defined in the template, ensuring it is the only metric tracked (excluding other metrics or SLAs). The number of log time metric configured in the template should appear in the log time metric in chart.
-
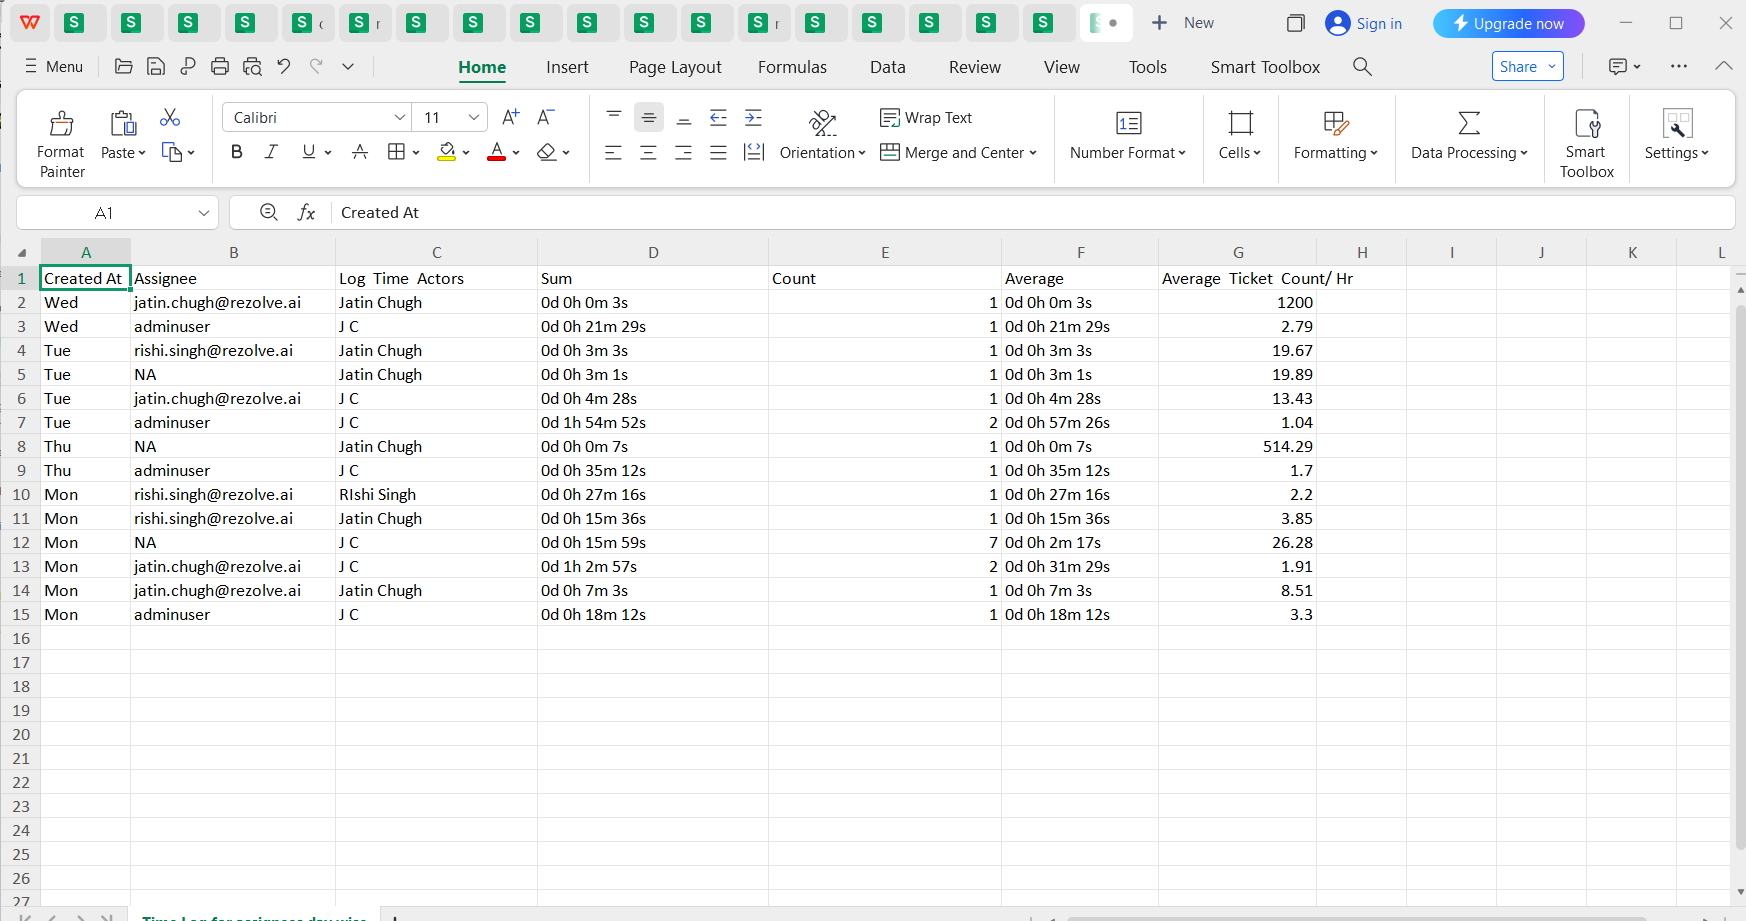
Aggregated Fields:
- Sum: Calculate the total log time accumulated across all tickets to provide an overall time expenditure.
- Count: Determine the total number of tickets to give context to the volume of work.
- Average: Compute the average time spent per ticket by the log time actor, offering insight into individual efficiency.
- Average Formula: Use the formula "3600 / Average" where 3600 represents seconds in an hour divided by the average time per ticket, yielding the velocity (i.e., how many tickets the log time actor can complete in an hour).
-
Group By Fields: All the fields defined in the template appears in group by fields. Allow grouping of aggregated data based on categories such as "created at" (week, days, months, quarter) or "assignee" to analyze trends or performance over specific periods or by individuals.
-
Sort Fields: Enable sorting of the chart data based on a single aggregate field (e.g., Sum, Count, or Average) to prioritize the display order, enhancing data interpretation.
-
Filters: Provide the option to segregate data using any field from the template (e.g., assignee, ticket status) to focus on specific subsets, while ensuring only Log Time-related data is considered (no other metrics or SLAs).
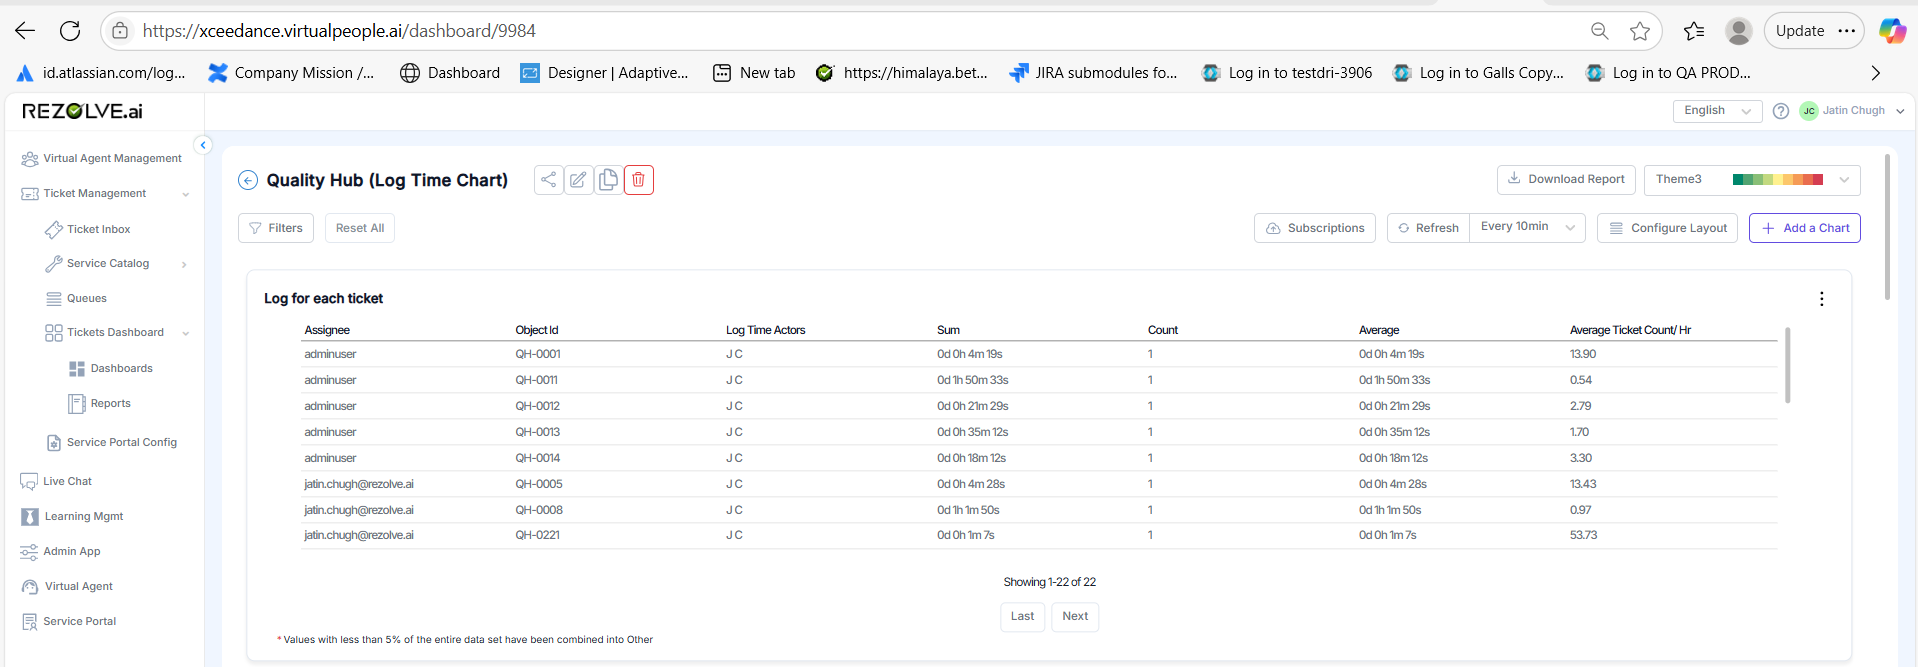
Using this chart the performance of the actors can be analyzed.
Filters
-
Chart Level: Filters specific to the Log Time Chart will adjust the displayed data (e.g., Sum, Count, Average, Average Formula) based on selected criteria, allowing for targeted analysis of time spent on tickets.
-
Dashboard Level: Filters applied at this level will uniformly affect all charts on the dashboard, including the Log Time Chart, to filter out Log Time data across different dimensions (e.g., time periods or assignees), ensuring a cohesive data view.
Reports
-
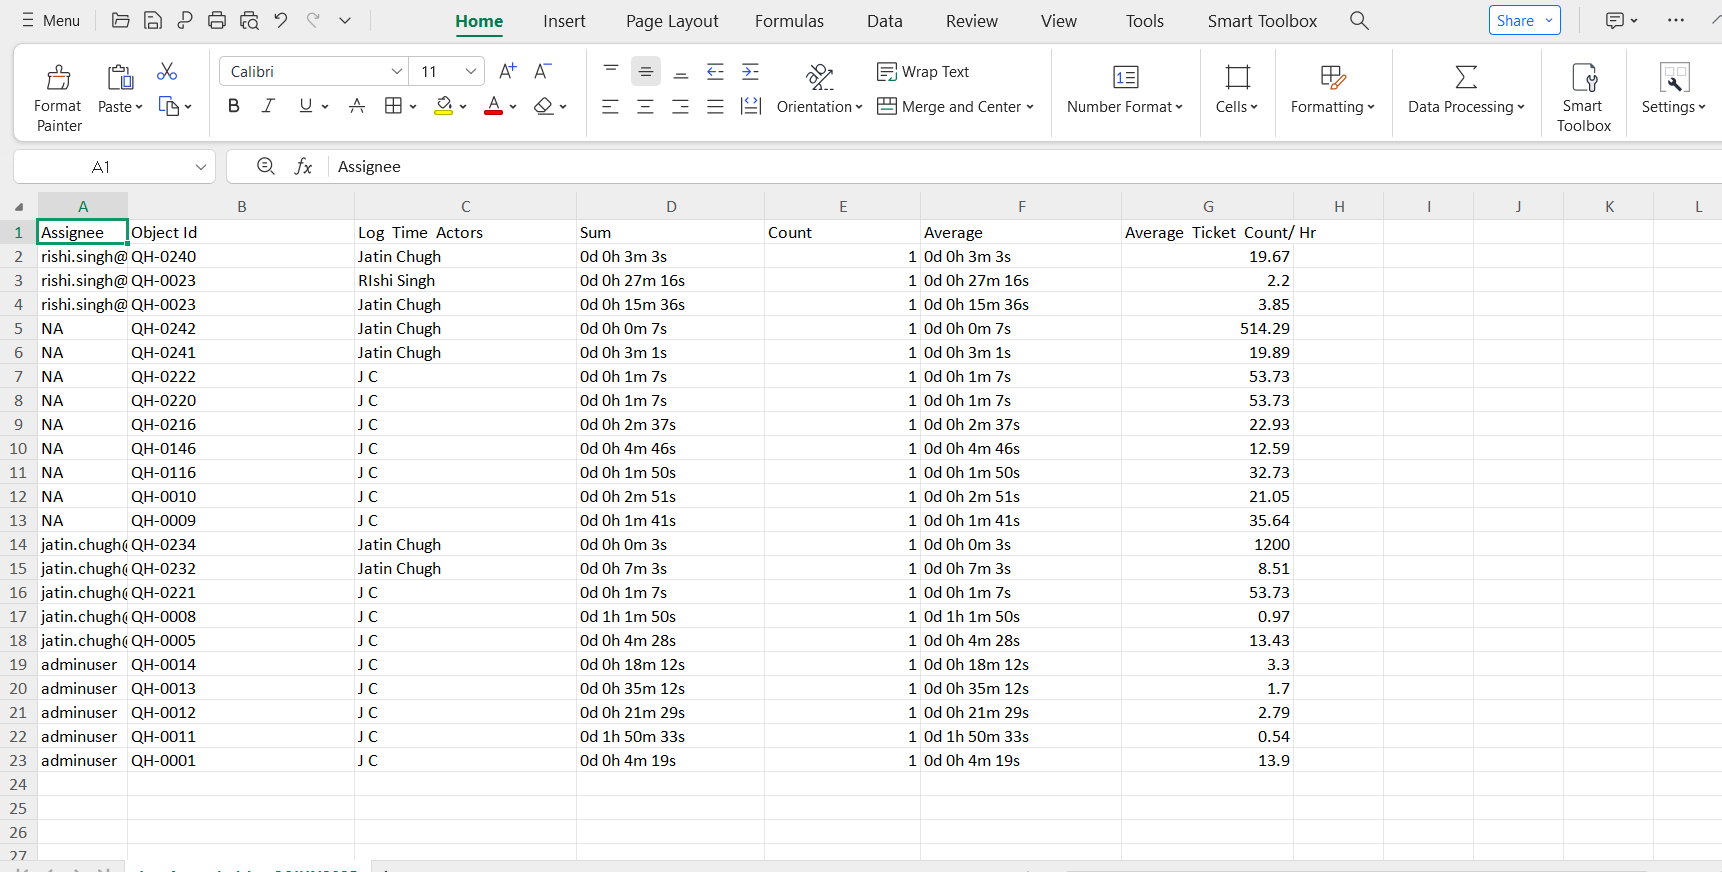
Chart Level Subscription and Export as CSV: The Log Time Chart can be set up for a subscription, allowing users to receive periodic updates (e.g., daily or weekly) based on their preference. When exported as a CSV file, it will include detailed Log Time data such as the total time spent (Sum), number of tickets (Count), average time per ticket (Average), and the velocity of the log time actor (Average Formula: 3600 / Average, indicating tickets completed per hour). The export will reflect any chart-level filters (e.g., by assignee or time period) and groupings (e.g., by week or month), ensuring the data is tailored and accurate for specific analysis needs.
-
Dashboard Level Subscription and Export as CSV: At the dashboard level, users can subscribe to receive updates encompassing all charts that include Log Time data. The CSV export will aggregate Log Time metrics across the dashboard, aligning with any dashboard-level filters (e.g., across multiple assignees or time ranges). This provides a holistic view, ensuring consistency and enabling cross-chart comparisons while maintaining focus solely on Log Time data.
-
Report Section Subscription and Export as CSV: Within the report section, users can subscribe to receive scheduled reports that compile Log Time data based on predefined report configurations. The CSV export will include aggregated Log Time details (Sum, Count, Average, Average Formula) tailored to the report's filters and groupings (e.g., quarterly trends or assignee performance). This ensures that all exported data remains accurate and exclusively reflects Log Time, supporting detailed reporting and decision-making.