Metrics & SLAs
Service Level Agreements (SLAs) and metrics are crucial for tracking ticket performance and ensuring timely resolution. They help organizations maintain service standards and identify areas for improvement.
Configuration of Metrics and SLA
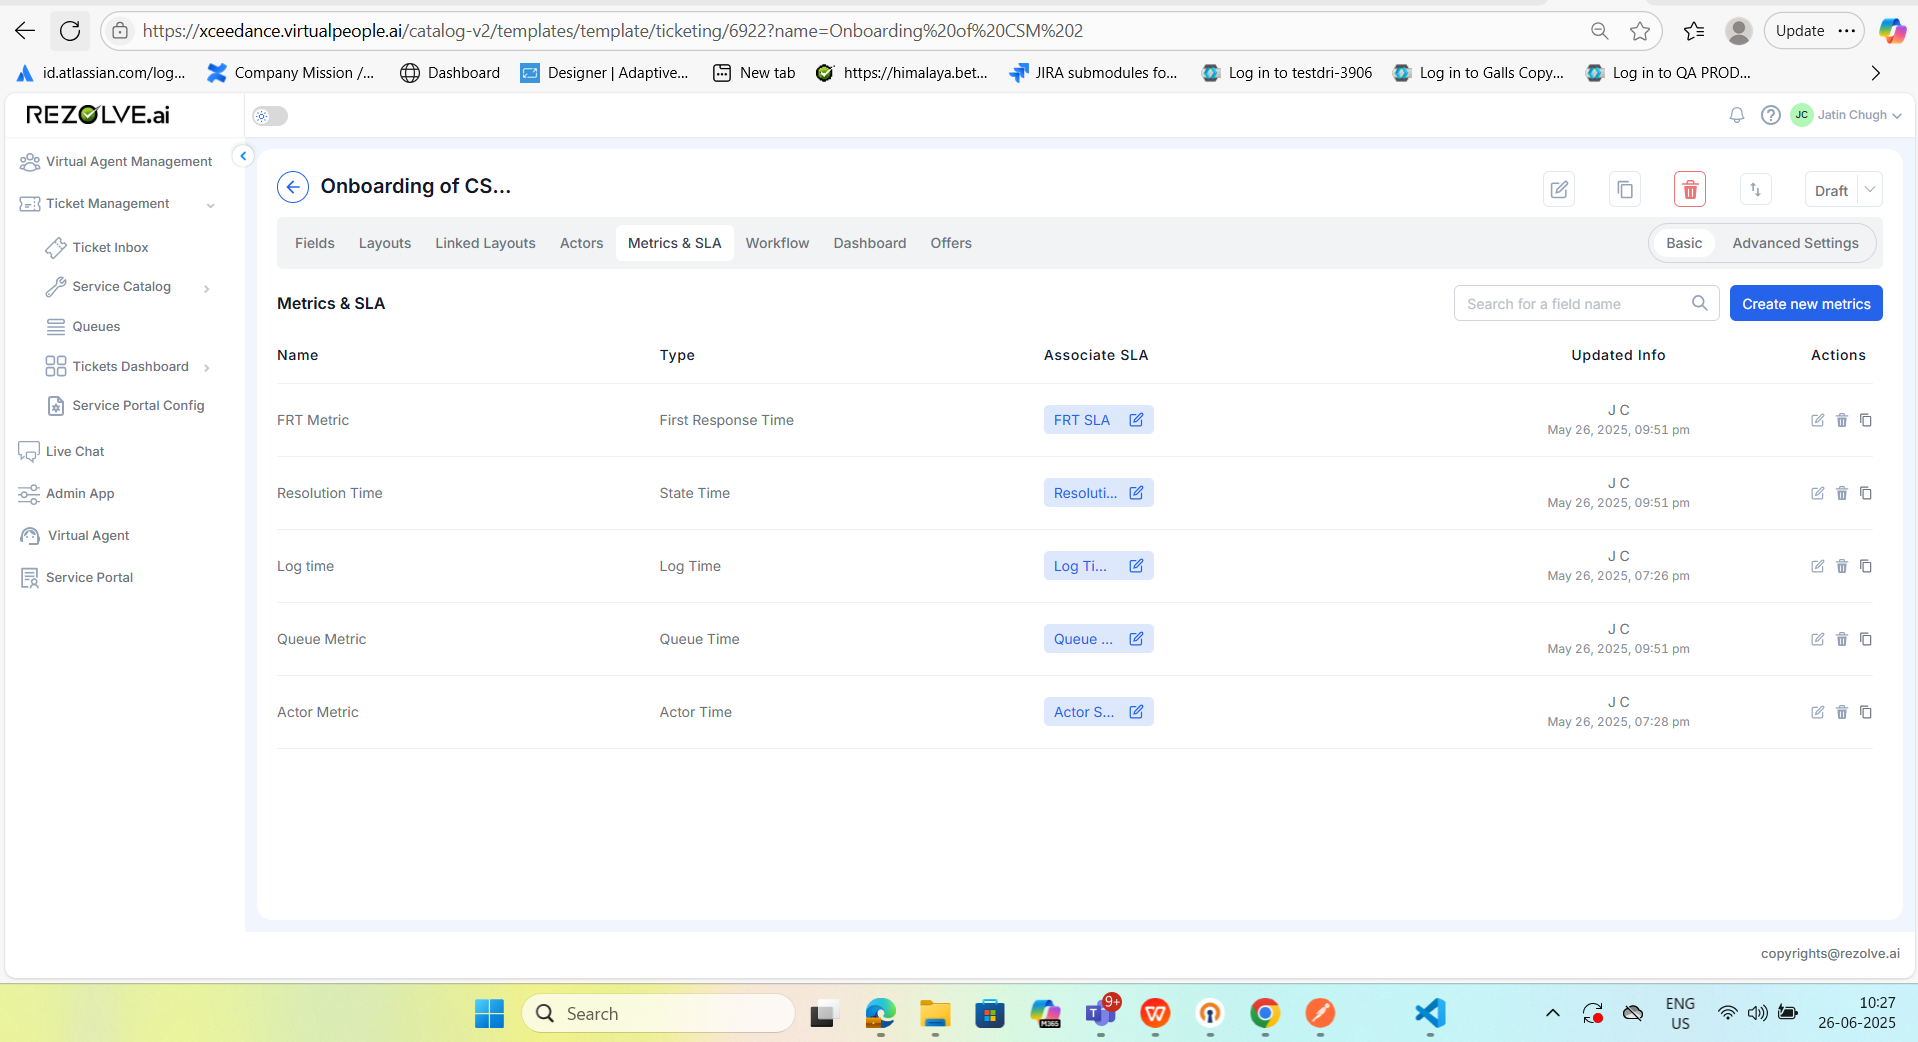
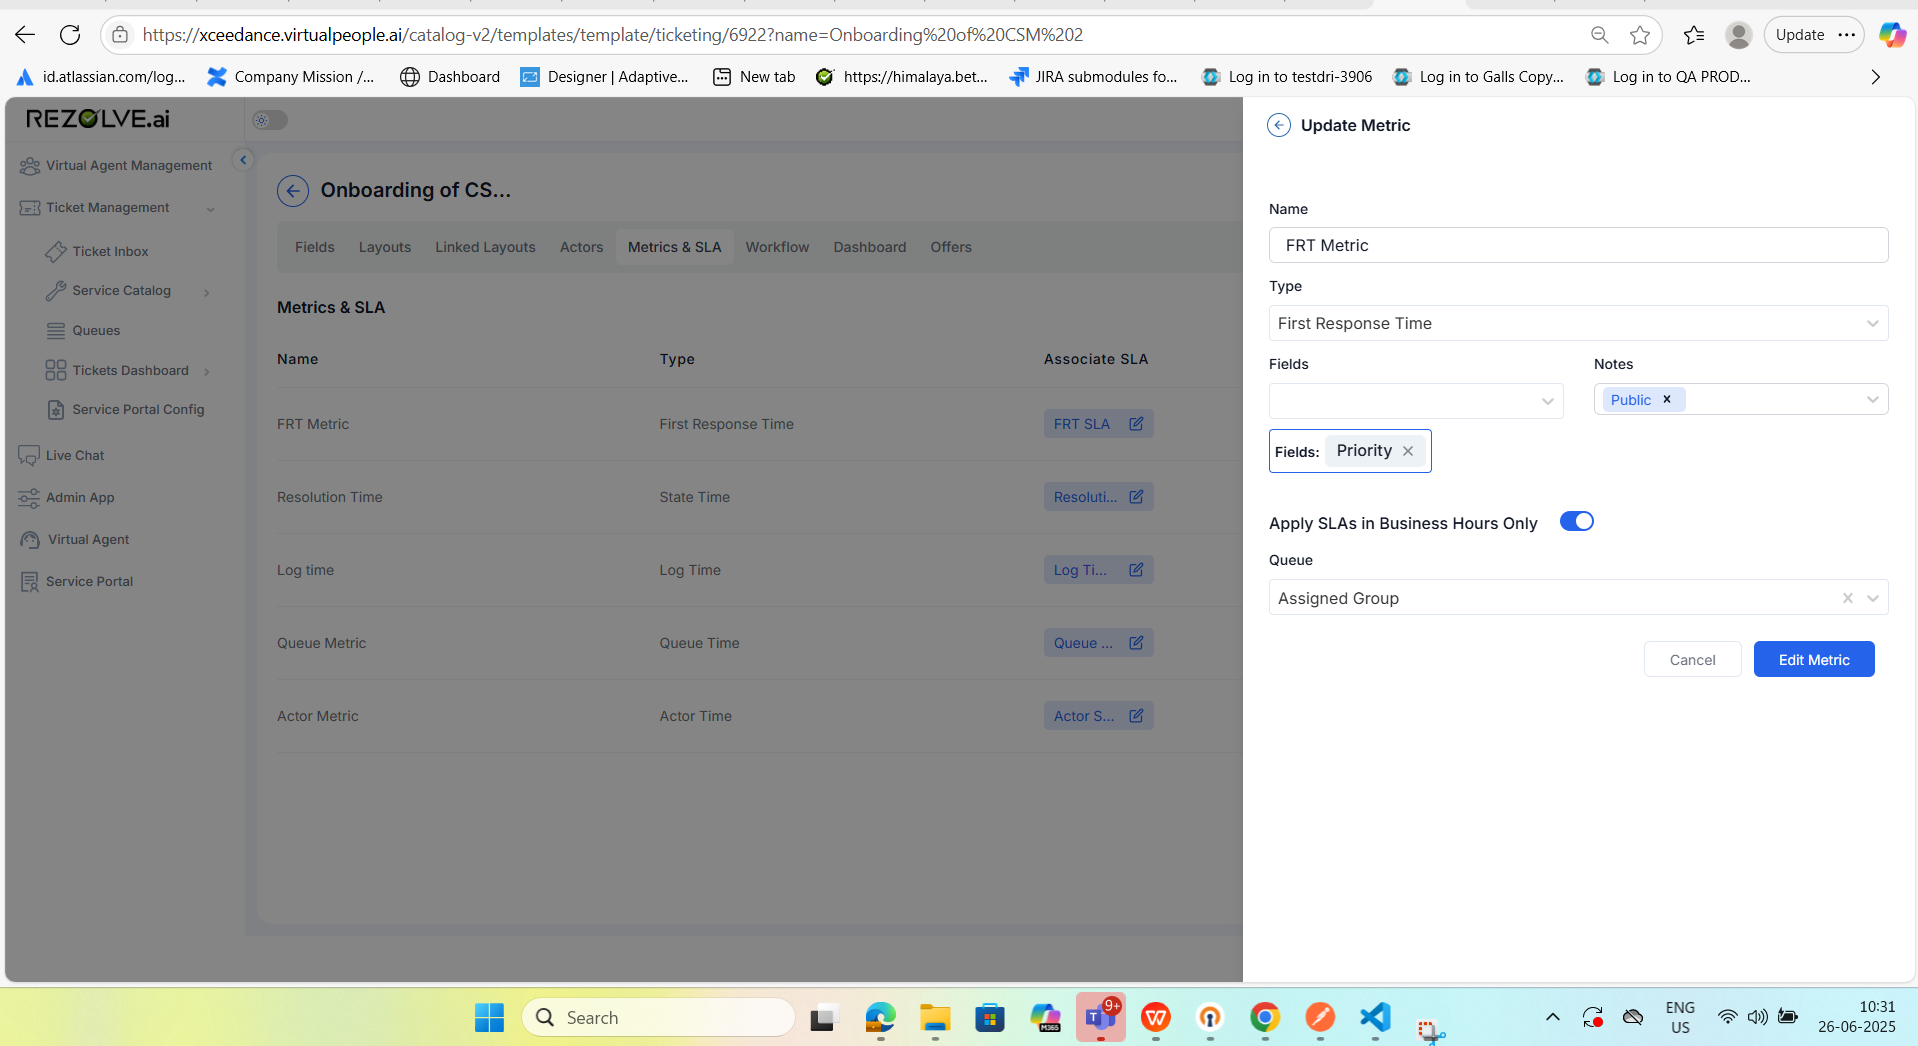
First Response Time
-
Name: FRT Metric
- This is the label you've given for the metric, e.g., "First Response Time."
-
Type: First Response Time
- This defines the logic behind the metric. For FRT, the timer starts when the ticket is created and stops when a response is first made (depending on what's configured).
-
Fields (Priority selected)
- This dropdown allows you to select fields from the template. If a user updates the selected field (e.g., Priority), the system will consider this as a response and stop the timer for FRT.
- ✅ This means: When the "Priority" field is updated on a ticket, it triggers the calculation of First Response Time.
-
Notes (Public selected)
- This dropdown lets you choose which type(s) of notes qualify as a response.
- ✅ Here, "Public" is selected. So when a public note is added to a ticket, that counts as the first response and stops the FRT timer.
NOTE: If both a field and a note type are selected in the metric configuration:
The First Response Time (FRT) timer stops when:
- Any one of the selected fields is updated (Field Condition)
OR
- Any one of the selected note types (e.g., Public, Private, Chase, Resolution) is added to the ticket (Notes Condition)
Resolution Time
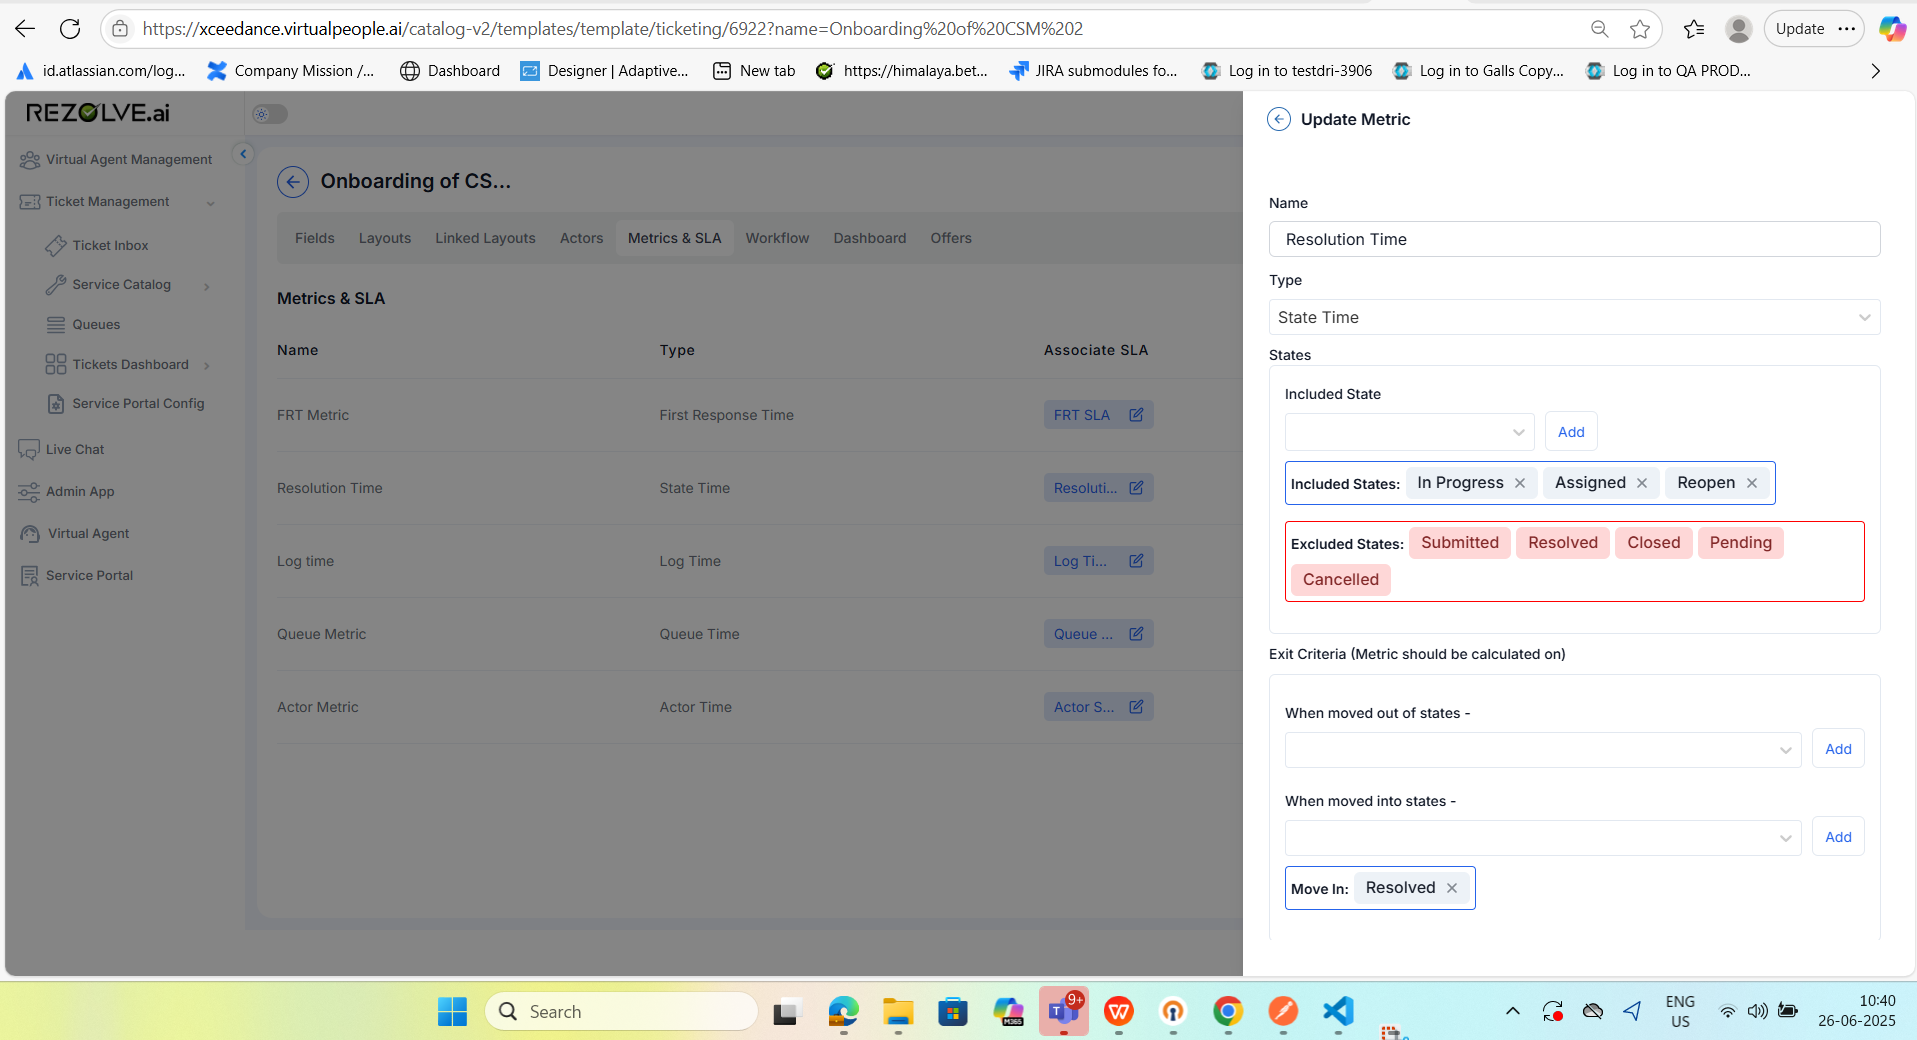
State Time Metric Behavior
-
Included States:
- Metric (e.g., Resolution Time) runs only while the ticket is in any of these states.
- Example: If "In Progress", "Assigned", or "Reopen" is selected → metric calculates in these states.
-
Excluded States:
- When the ticket moves to these states, the metric pauses (not calculated).
- Example: States like "Submitted", "Resolved", "Closed", "Pending", "Cancelled".
- If ticket transitions from included → excluded → included → metric continues from where it paused.
-
Move Out of States (Exit Criteria):
- When ticket exits the specified state(s), the metric stops permanently.
- Useful if you want to end metric tracking when leaving a specific state.
-
Move Into States (Exit Criteria):
- When ticket enters the specified state(s), the metric stops permanently.
- Example: when ticket moves into "Resolved" → metric stops completely.
Log Time
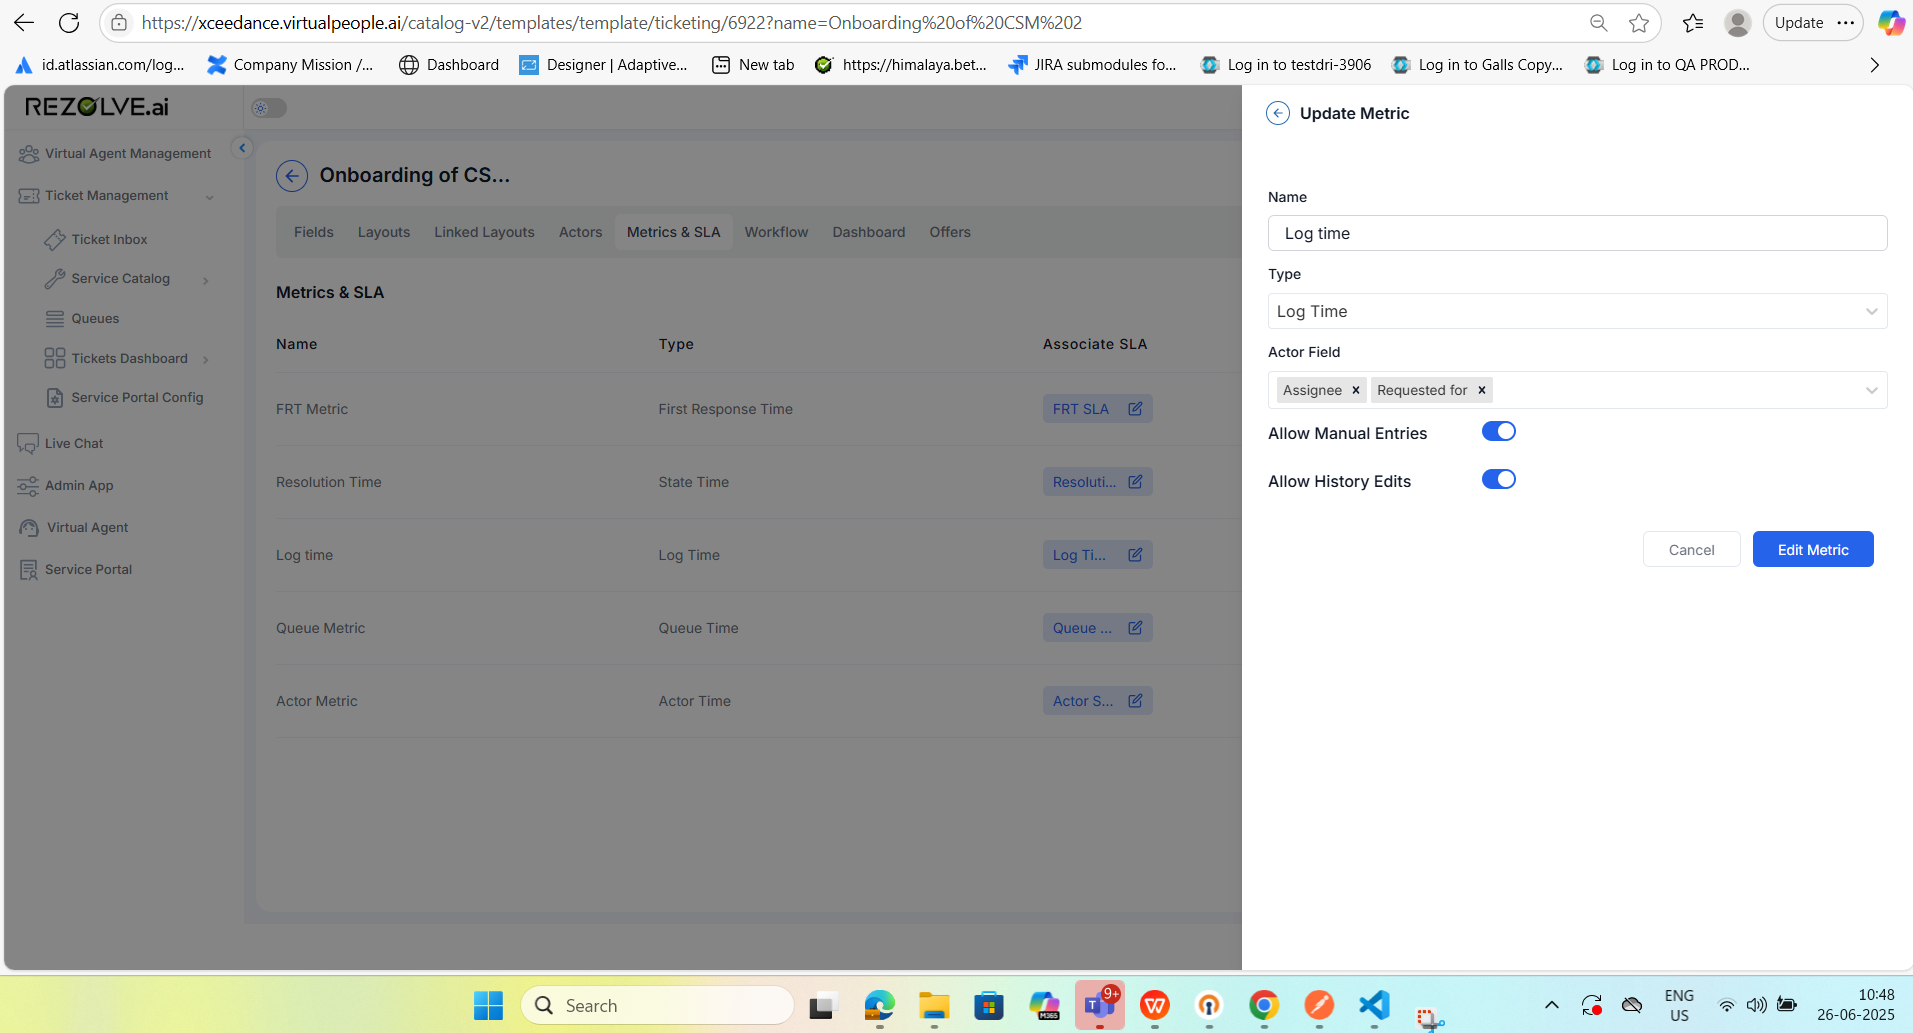
Log Time Metric – Configuration Explained
-
Type:
- Log Time: Tracks time spent by specific actors on a ticket.
-
Actor Field:
- This is a multi-select dropdown.
- You select roles like Assignee, Requested For, etc.
- Log time is calculated only for those selected actors.
- Example: If only Assignee is selected, log time will count only when the assignee is working on the ticket.
-
Allow Manual Entries:
- If enabled, users can manually add log time from the Agent UI.
- Useful when automatic tracking isn't sufficient (e.g., time worked offline).
-
Allow History Edits:
- If enabled, users can go into the log time history and edit their own entries.
- Enhances flexibility, especially if entries need correction.
Queue Metric
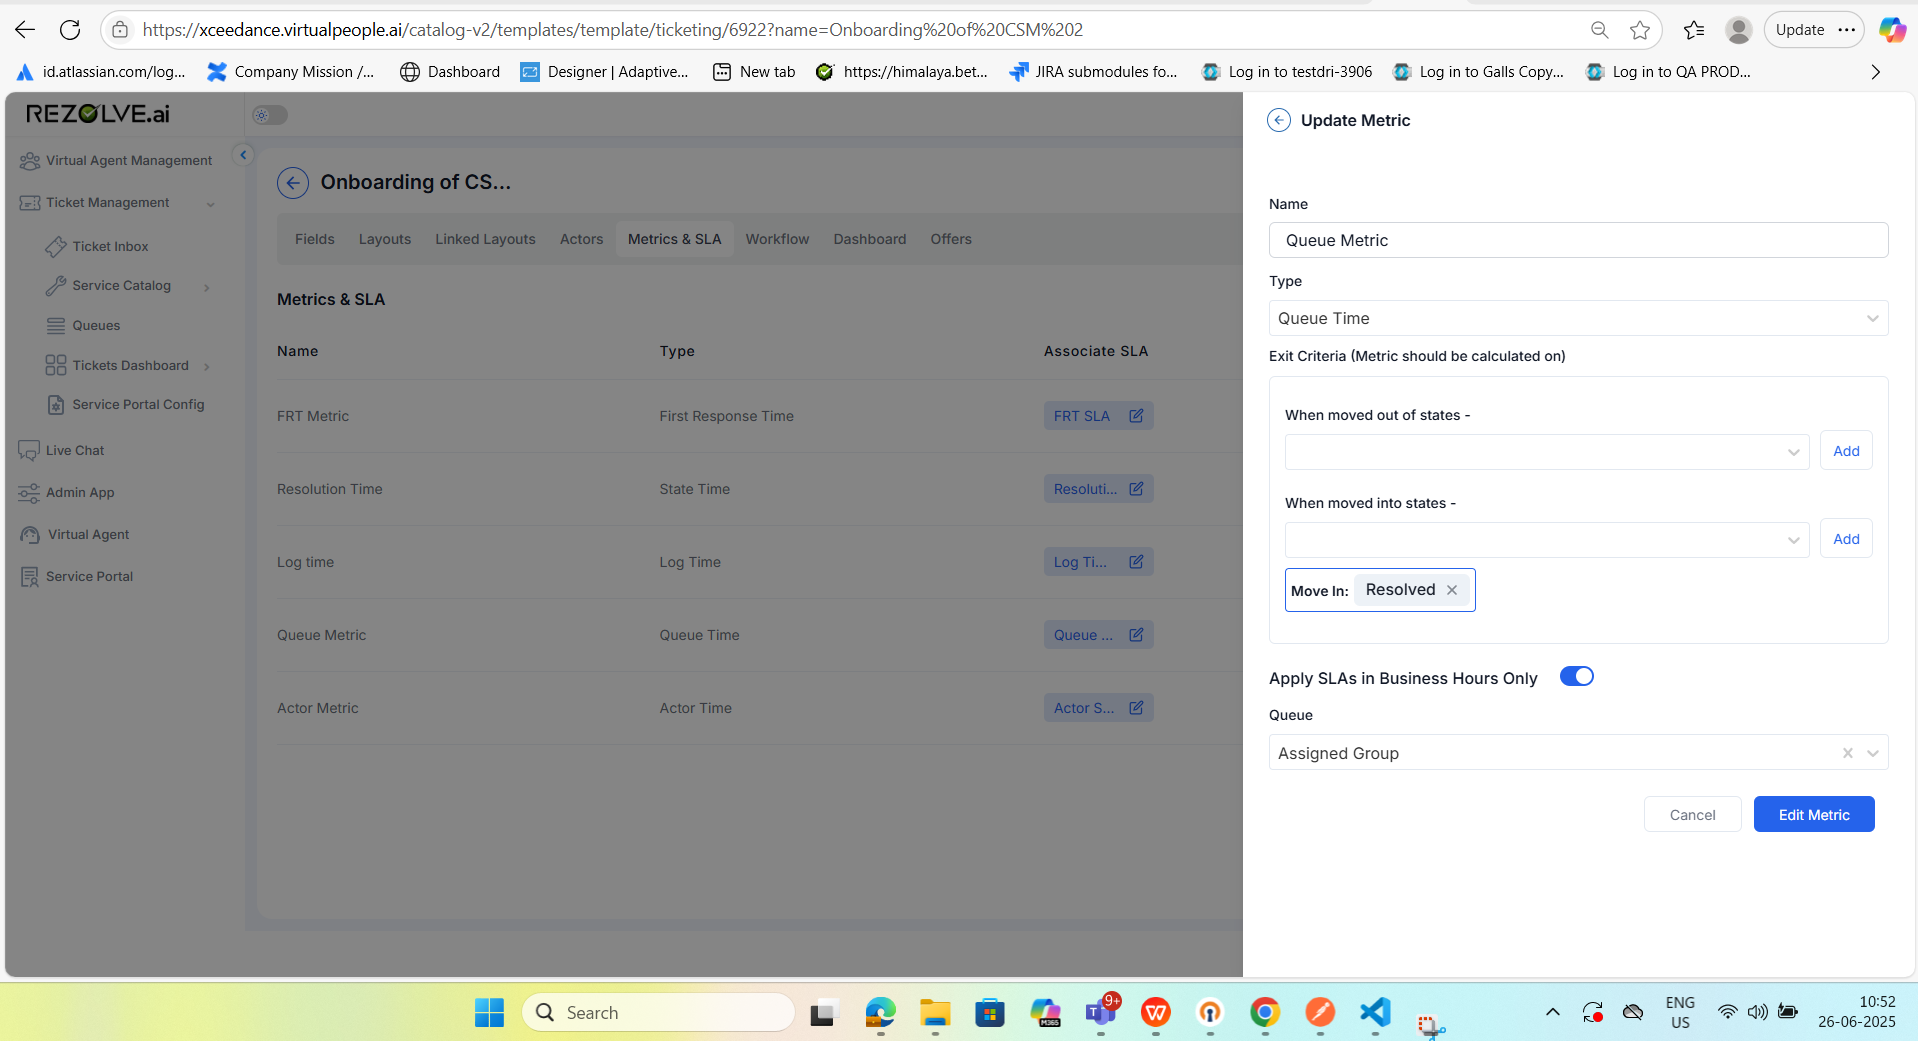
Queue Metric – Configuration Explanation (with Exit Criteria Only)
-
Type: Queue Time
- This metric measures how long a ticket stays in a particular queue (like Assigned Group) before a defined exit event happens.
-
Exit Criteria (Metric stops calculating when these conditions are met):
- When Moved Into State:
- Metric stops permanently when the ticket moves into the configured state (e.g., Resolved).
- This means the queue time is calculated from the moment the ticket enters the selected queue until it reaches the Resolved state.
- When Moved Out of State:
- (Not configured in this screenshot but available if needed)
- If configured, the metric would stop calculating when a ticket leaves a specific state.
- When Moved Into State:
-
Queue (Targeted Queue):
- Queue selected here (Assigned Group) is the queue for which the queue time will be measured.
- Metric activates only when the ticket is in this queue.
Actor Time
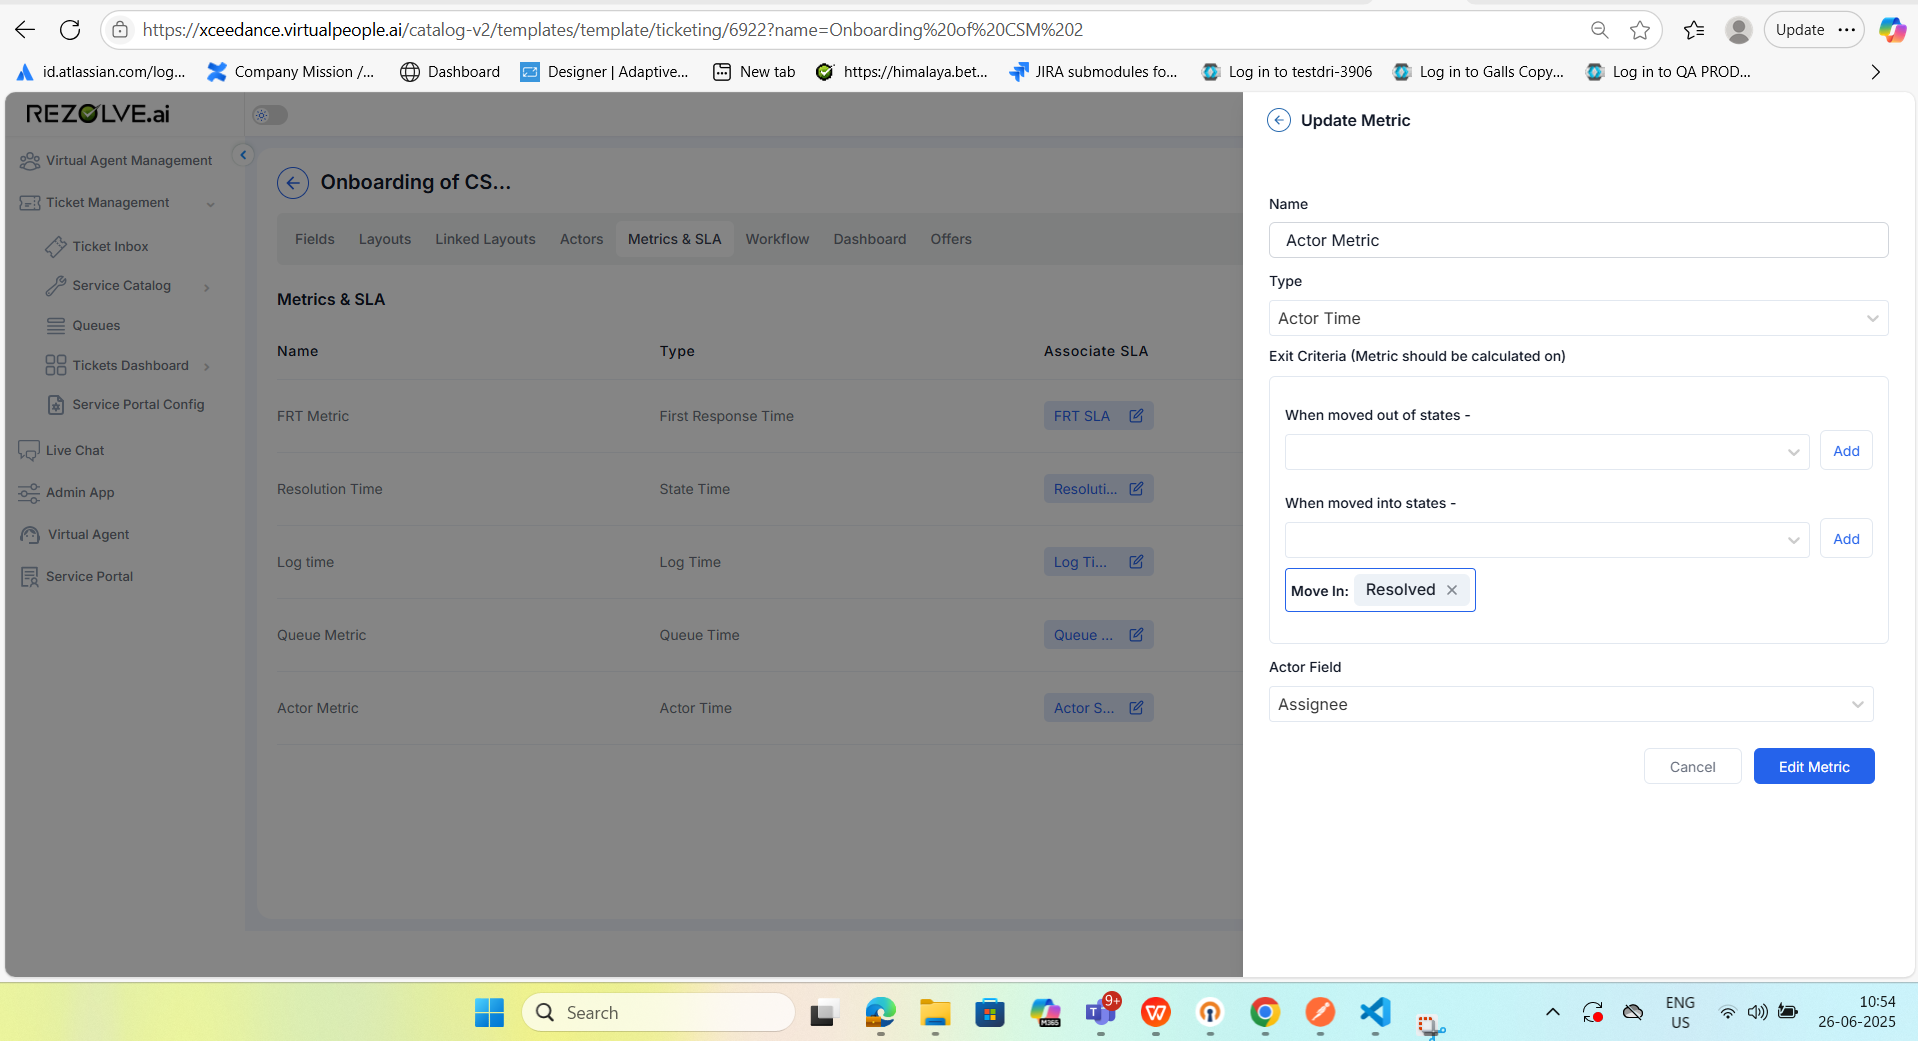
Actor Time Metric – Configuration Explained
-
Type: Actor Time
- Measures the total time spent by a specific actor (e.g., Assignee) on a ticket.
-
Actor Field:
- Single-select field (unlike Log Time metric which supports multi-select).
- Indicates which actor's activity duration will be tracked.
- In this case, Assignee is selected, so time is calculated based on how long the ticket remains assigned to a user.
-
Exit Criteria (defines when the metric stops calculating):
- When Moved Into State:
- Metric stops permanently when the ticket enters a defined state (here: Resolved).
- So, if a ticket is resolved, the actor time metric will stop and record final value.
- When Moved Out of State:
- Not configured in this case, but if added, the metric would stop when the ticket moves out of that specific state.
- When Moved Into State:
-
Usage:
- Helps calculate individual contributor time — how much time a ticket was handled by a specific actor (e.g., an assignee) before it reached closure or a specified state.
SLA Configuration
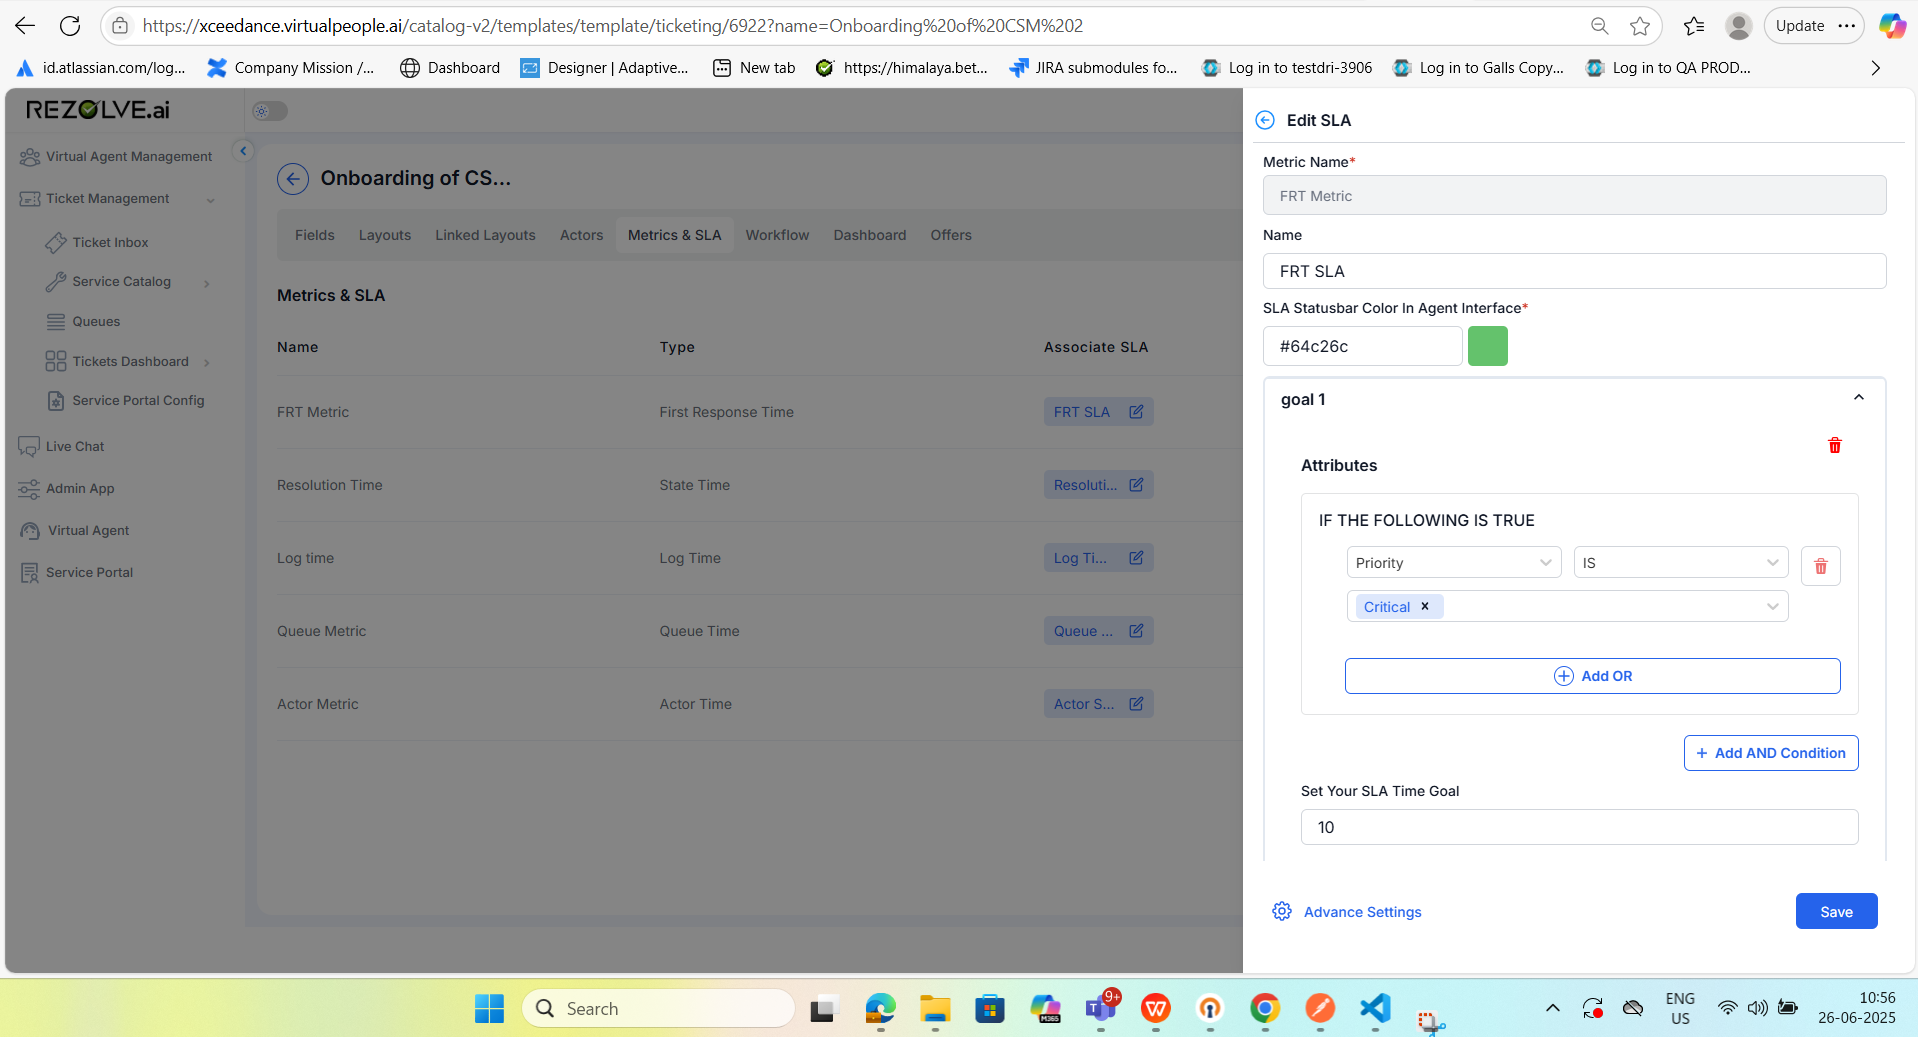
SLA Fields
- Name: Name of SLA (e.g., FRT SLA).
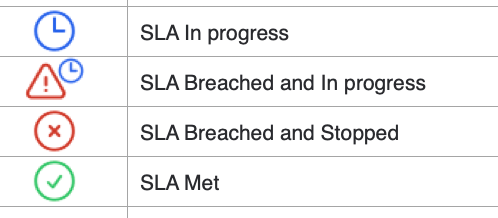
- SLA Status bar Color: The color shown when SLA begins.
- Goals: Multiple conditions can be added using AND / OR logic.
- Time Goal: Time in minutes for each goal.
Example Goals
- Goal 1: Priority IS Critical → SLA Goal: 10 min.
- Goal 2: Priority IS High → SLA Goal: 15 min.
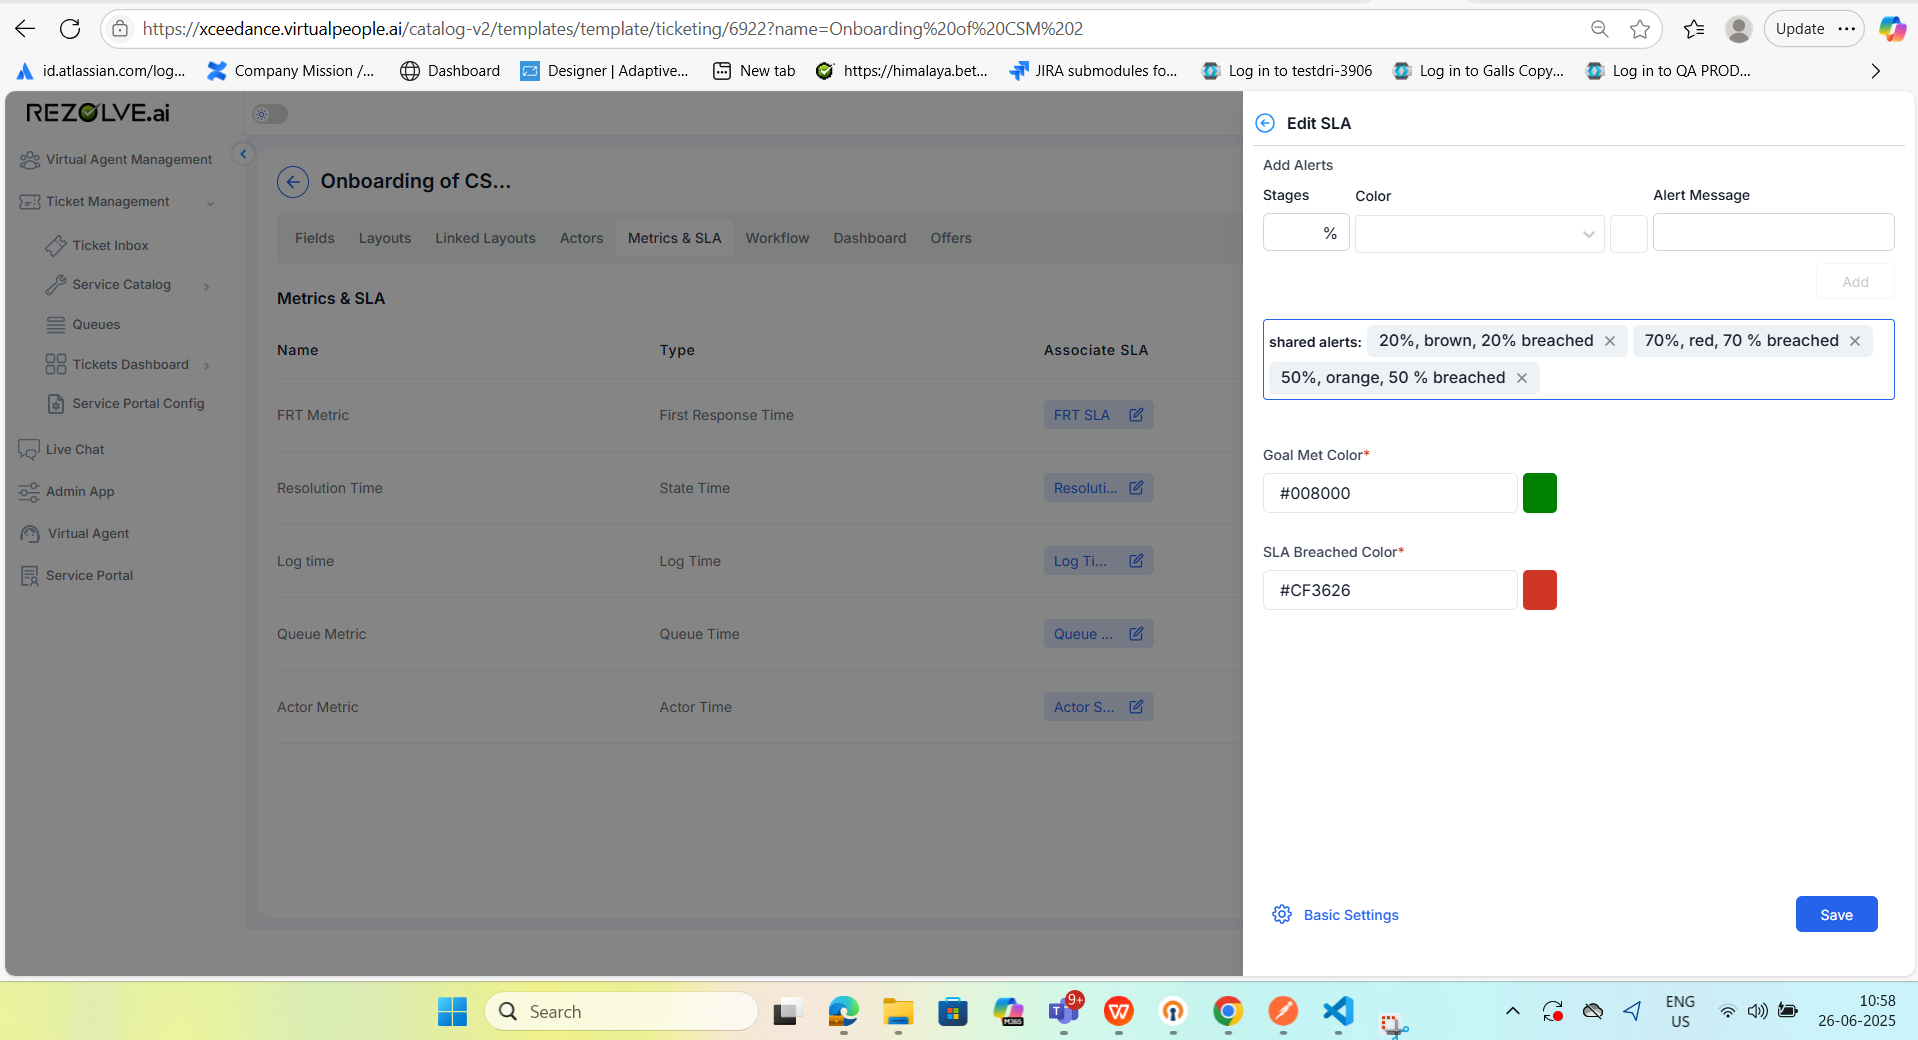
Advanced Settings
- Shared Alerts: Trigger notifications before SLA breach (e.g., 20% used, 50%, 70% used).
- Goal Met Color: Color indicating SLA met (e.g., green).
- SLA Breached Color: Color indicating SLA breached (e.g., red).
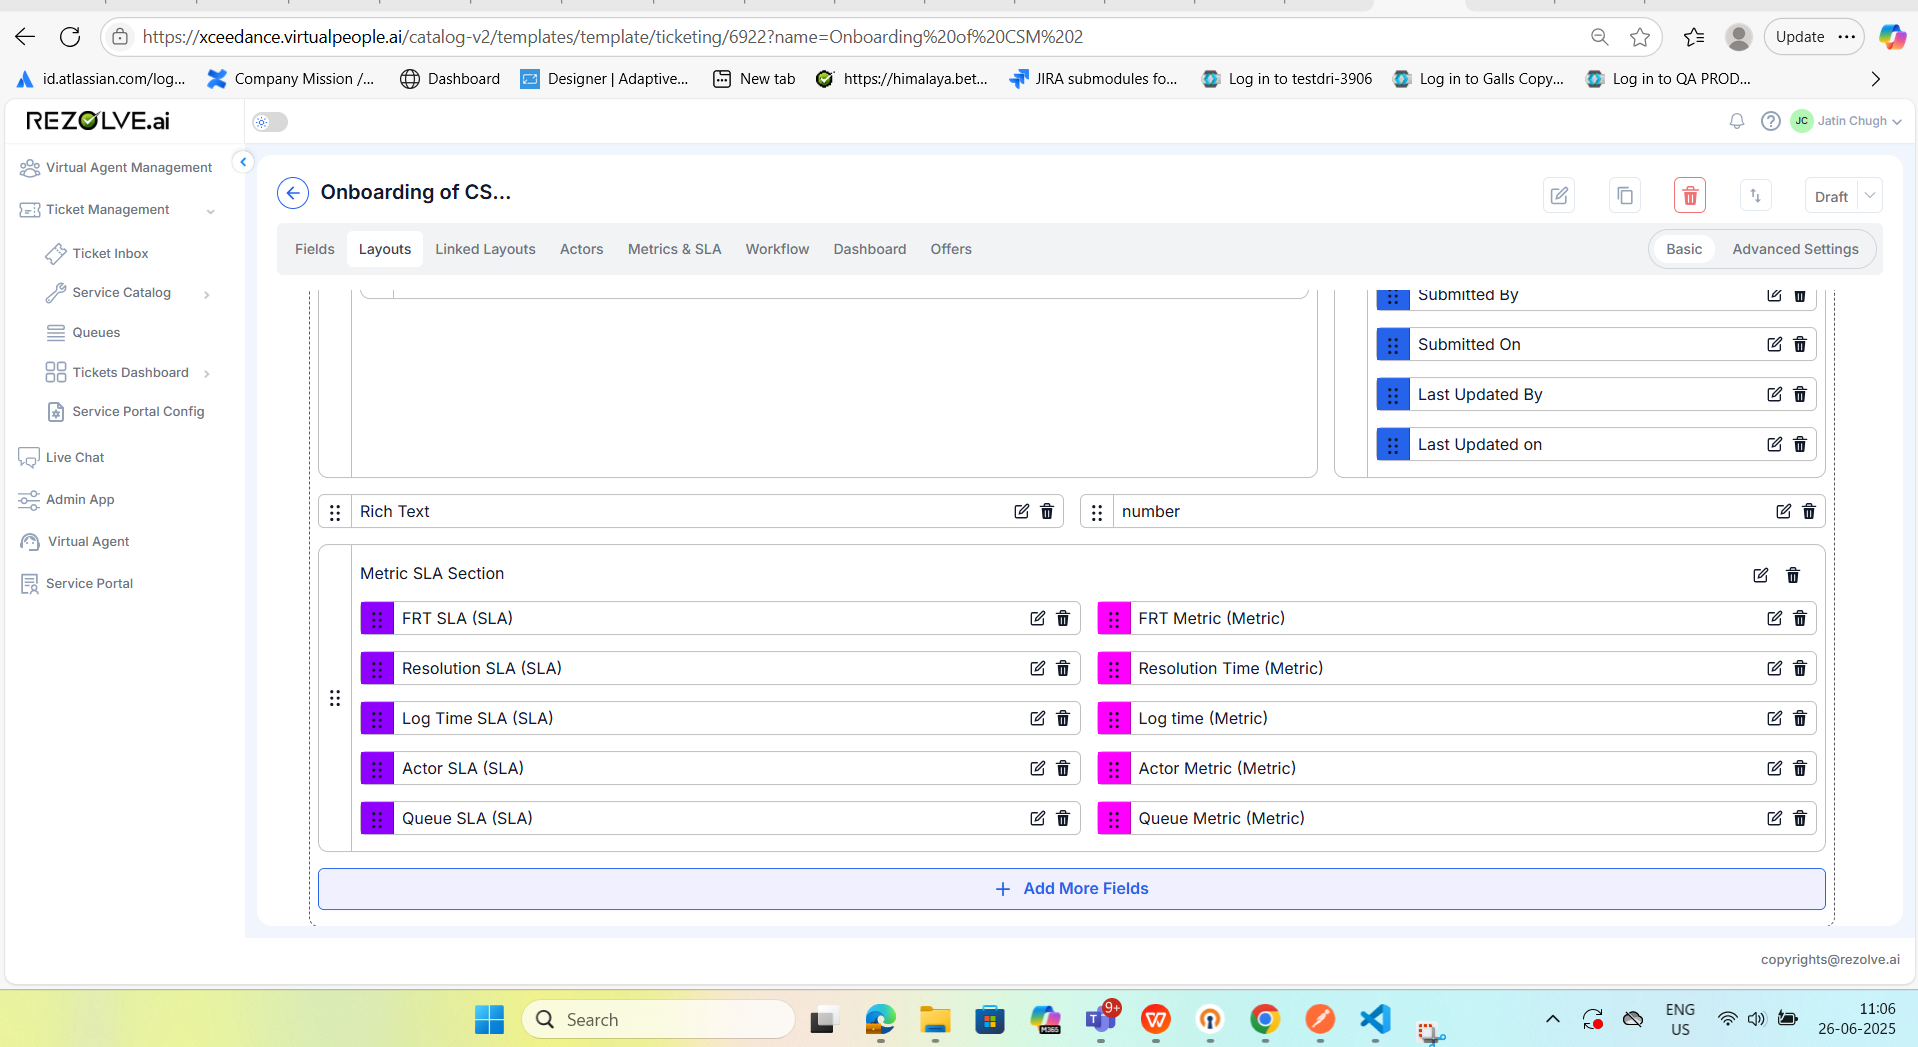
Layout Configuration for Metrics & SLA

SLA and Metric Fields via "Special Field"
- Metrics (e.g., FRT Metric, Resolution Time) and SLAs (e.g., FRT SLA) can be added using the "Special Field" option.
- These fields can be placed on both the inbox view and the detail view of the ticket.
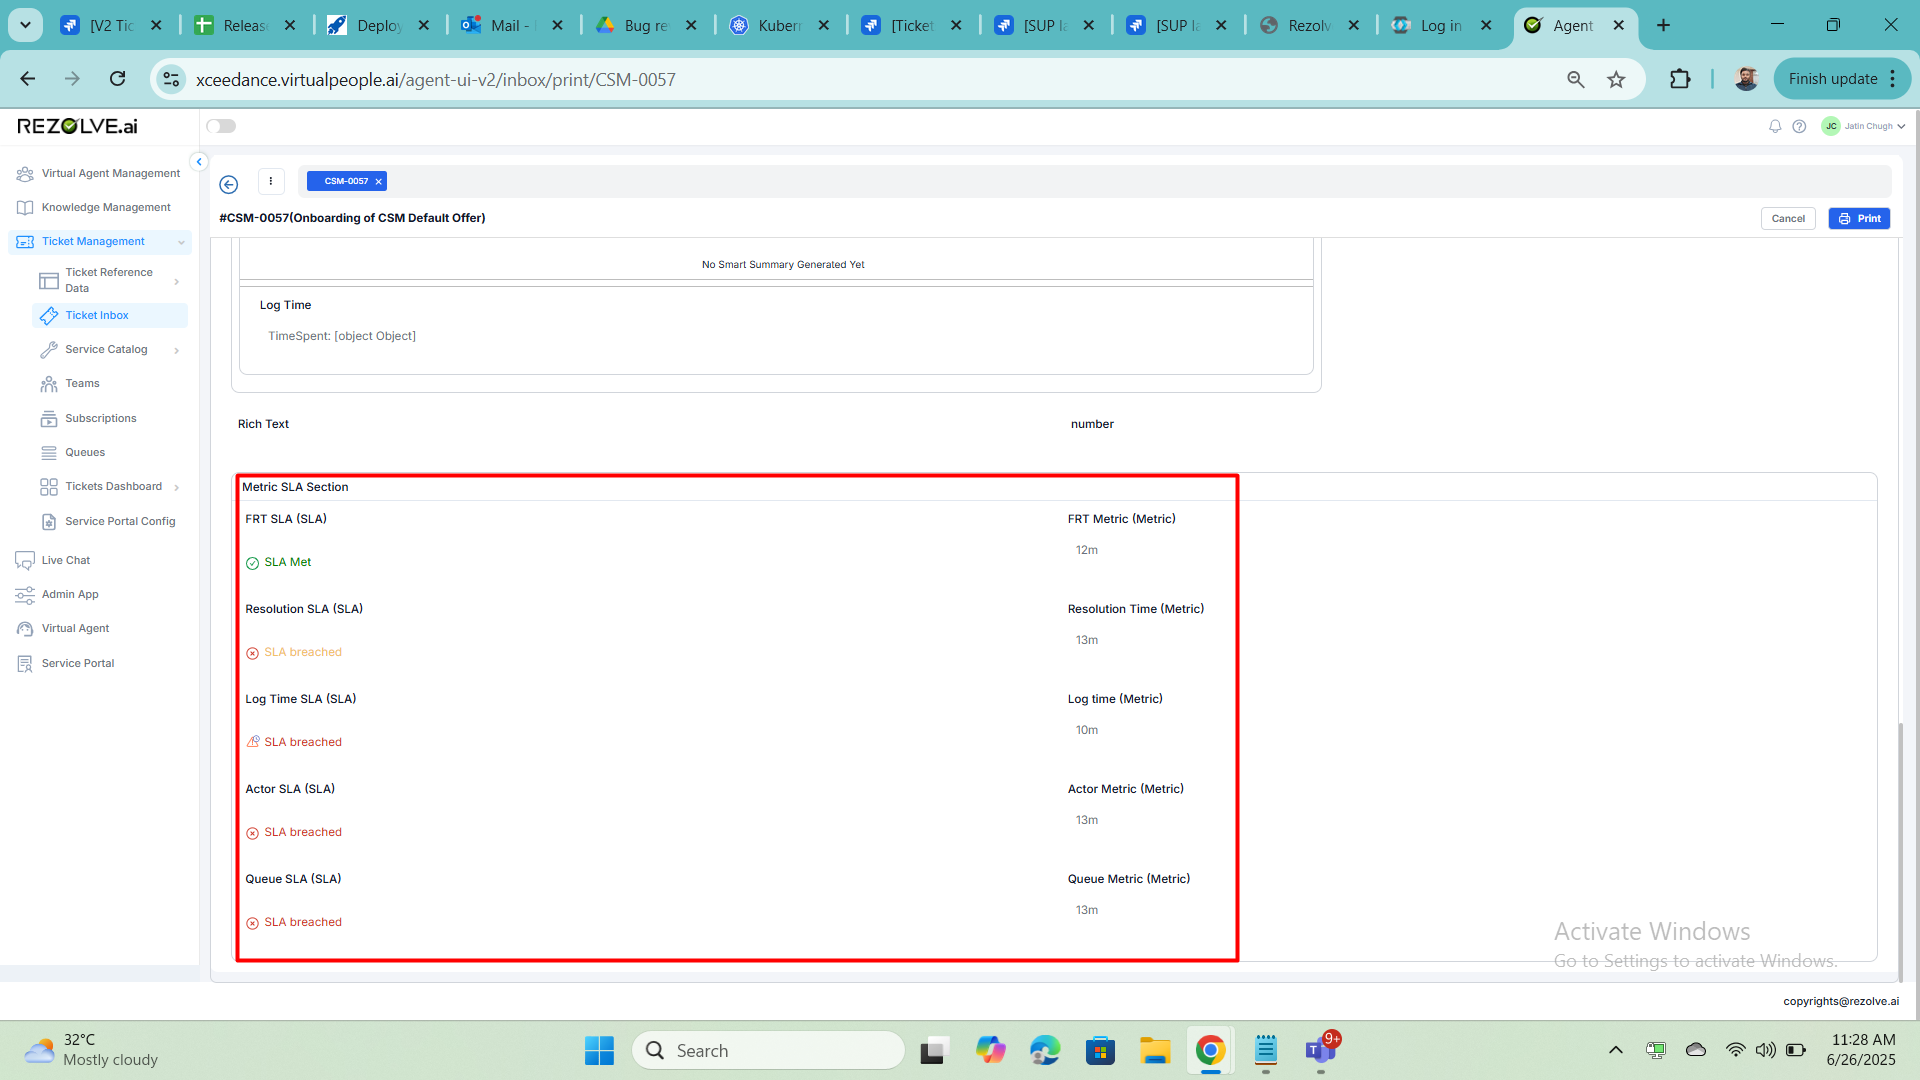
Section-Wise Placement
- SLA and metric fields can be placed inside different sections (like "Metric SLA Section").
- Section containers allow grouping related SLA/metric fields for better readability and organization.
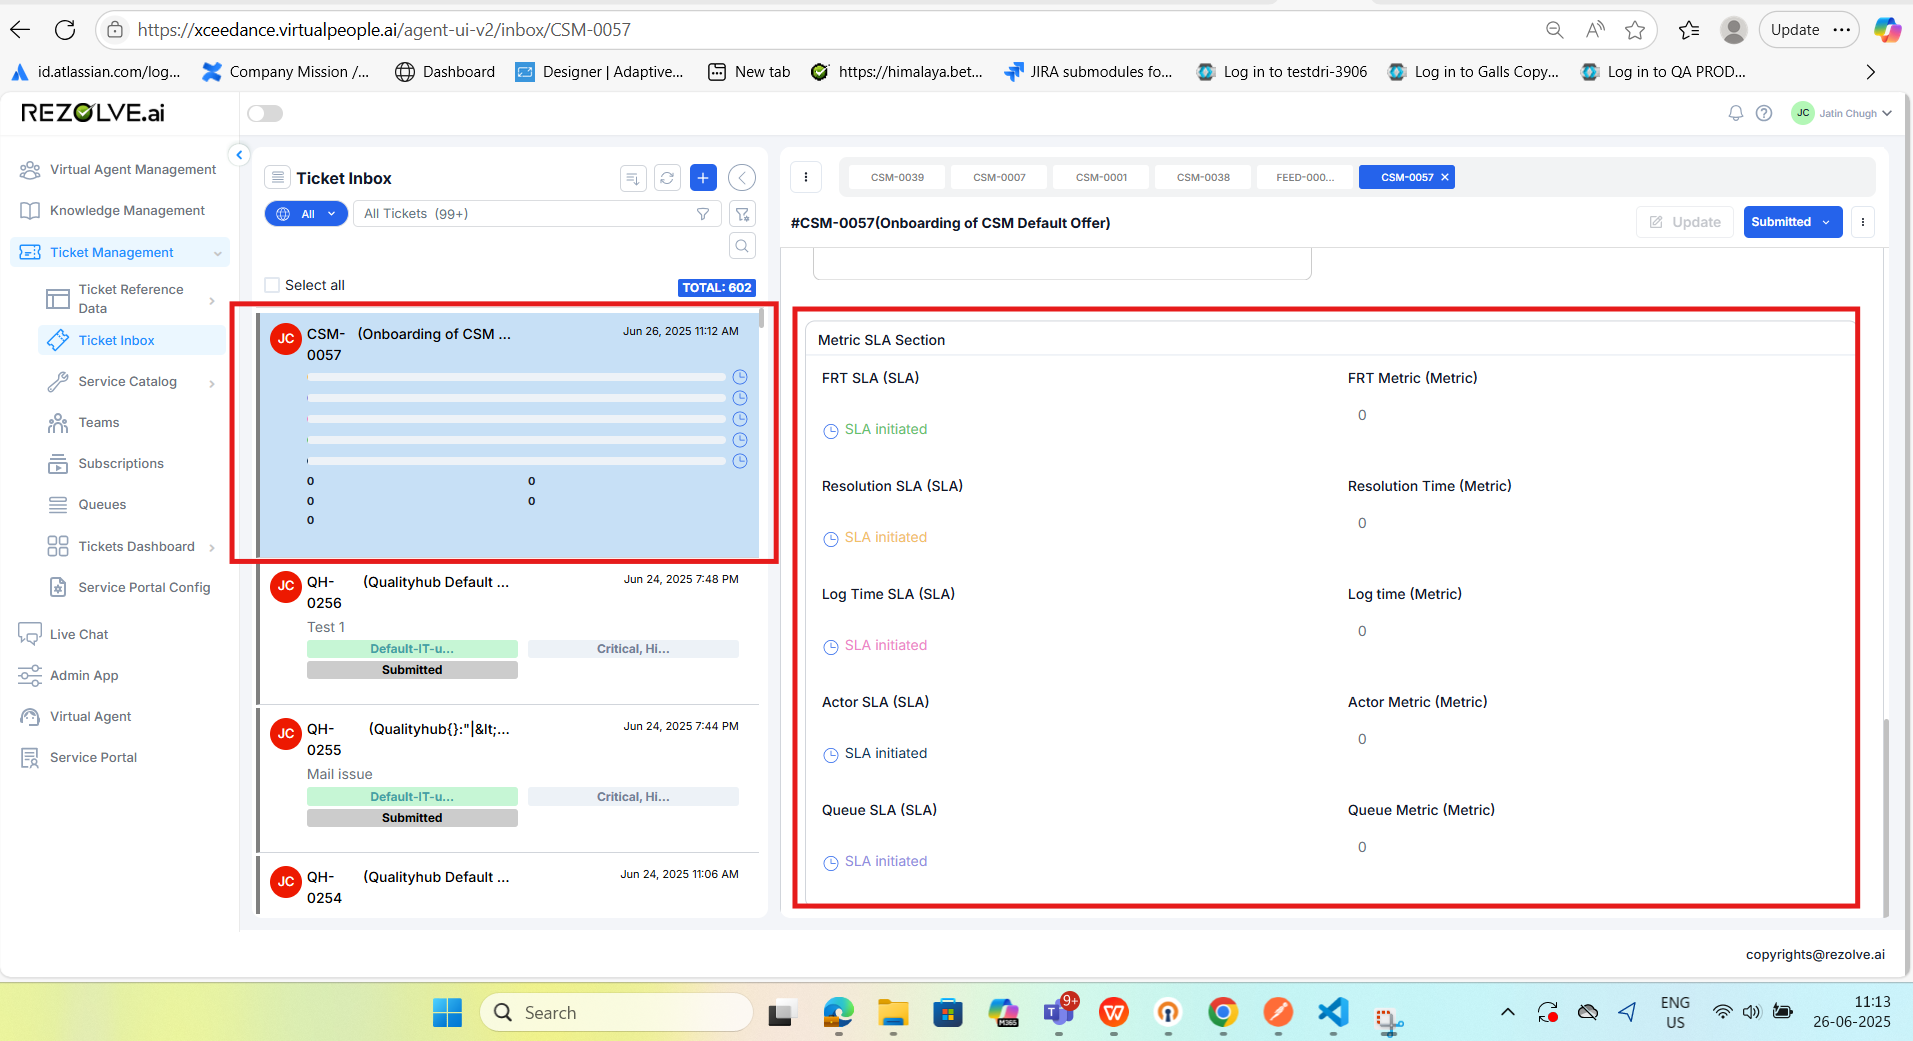
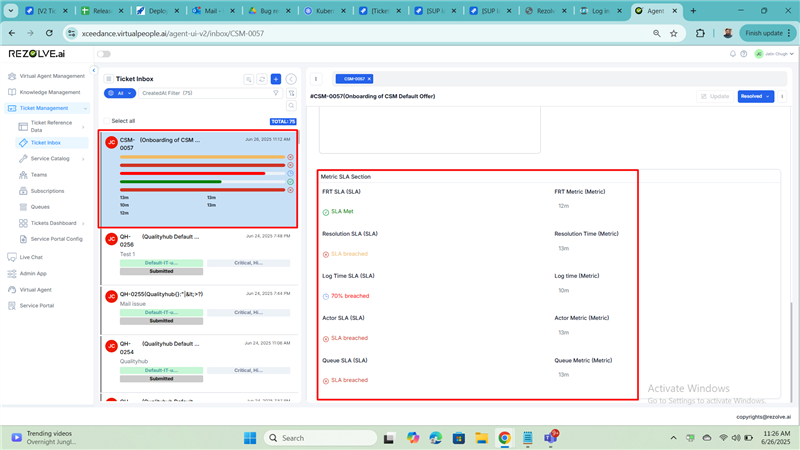
Display Format Options for SLA
SLA fields can be displayed in one of the following formats:
- Bar: Visual progress bar for SLA countdown.
- Number: Numeric time remaining or elapsed.
- Badge: Colored badge indicator (goal met/breached).
The user can choose the format based on visual or functional preferences.
Admin App Configuration
Business Hours Configuration Flow
To apply business hours for SLA metrics like FRT, the following steps must be performed:
- Navigate to the Admin App.
- Configure the desired business hours (e.g., 10 AM to 6 PM).
- Associate these business hours with a calendar within the Admin App.
- Optionally, define holidays that should be excluded from SLA calculations.
- Once the calendar setup is complete, it can be linked to a queue to ensure that SLA metrics respect the configured business hours and holidays.
This setup ensures that metrics such as FRT are calculated only within the specified working hours and exclude weekends or holidays.
Agent UI Behavior

Metrics with Business Hours Toggle
FRT Metric Behavior with Business Hours Toggle Enabled
When the "Apply SLAs in Business Hours Only" toggle is enabled for a metric (e.g., First Response Time - FRT), the metric calculation considers only the defined business hours. For example, if business hours are 10:00 AM to 6:00 PM, the FRT will only count the time falling within this window.
Scenarios:
| Case | Ticket Creation Time | Response Time | FRT (in business minutes) | Explanation |
|---|---|---|---|---|
| 1 | 5:00 PM | 6:00 PM | 60 mins | Entire response falls within business hours. |
| 2 | 5:00 PM | 7:00 PM | 60 mins | Time beyond 6 PM is outside business hours and is ignored. |
| 3 | 5:00 PM | 11:00 AM (next day) | 120 mins | 60 mins on Day 1 (5 PM to 6 PM) + 60 mins on Day 2 (10 AM to 11 AM). |
| 4 | 6:00 PM | 7:00 PM | 0 mins | Both creation and response are outside business hours. |
| 5 | 6:00 PM | 11:00 AM (next day) | 60 mins | Only 10 AM to 11 AM on the next working day is within business hours. |
Note: Weekends and holidays are also excluded from SLA calculations if not part of defined business hours.
SLA Behavior When Toggle Button is ON
Scenario:
- Priority: High
- Resolution Time Goal (SLA): 60 business minutes
- Business Hours: 10:00 AM – 6:00 PM
- Ticket Creation Time: 5:30 PM (Day 1)
- Agent Worked: 5:30 PM to 6:00 PM (30 minutes)
- Remaining SLA Time: 30 business minutes
- Next Business Start: 10:00 AM (Day 2)
- SLA Deadline: 10:30 AM (Day 2)
At 7:00 PM (Day 1)
- Business hours are already over (ended at 6:00 PM)
- SLA countdown is still running
- Time until SLA breach is 30 mins (business), which maps to 10:00 AM to 10:30 AM (Day 2)
- If user checks SLA at 7:00 PM (Day 1), UI shows:
- Time to Breach: 14 hours 30 minutes
Why?
- Time from 7:00 PM (Day 1) to 10:30 AM (Day 2) is 14 hours 30 mins in real-time, but this maps to only 30 mins of remaining SLA (business time).
- SLA clock is running overnight, but the UI shows a real-time countdown until the next SLA milestone — when the breach would happen in actual time.
Summary
| Time | SLA State | Explanation |
|---|---|---|
| 5:30 PM – 6:00 PM (Day 1) | Running | Agent used 30 out of 60 minutes |
| 6:00 PM – 10:00 AM (Day 2) | Paused | Outside business hours |
| 10:00 AM – 10:30 AM (Day 2) | Resumes | Agent has 30 mins to resolve before breach |
| 7:00 PM (Day 1) – User checks | SLA shows 14h 30m | Time until 10:30 AM next day when SLA will breach (real time) |
When Business Hours Toggle is OFF
If the toggle is disabled, the FRT metric / Resolution Metric and Queue Metric is calculated in absolute time (i.e., real-time) and does not consider business hours or holidays. The metric counts all minutes between ticket creation and the first response, based on the SLA goal defined in configuration.
- Metric calculation is continuous — 24x7 — regardless of working hours or holiday calendars.
- SLA follows the goal defined in the SLA config.
- Useful for teams offering around-the-clock support or measuring overall responsiveness.
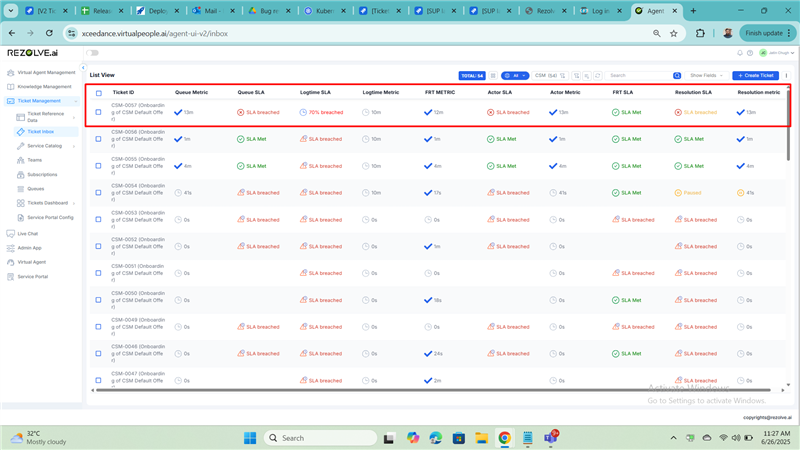
Dashboard Integration
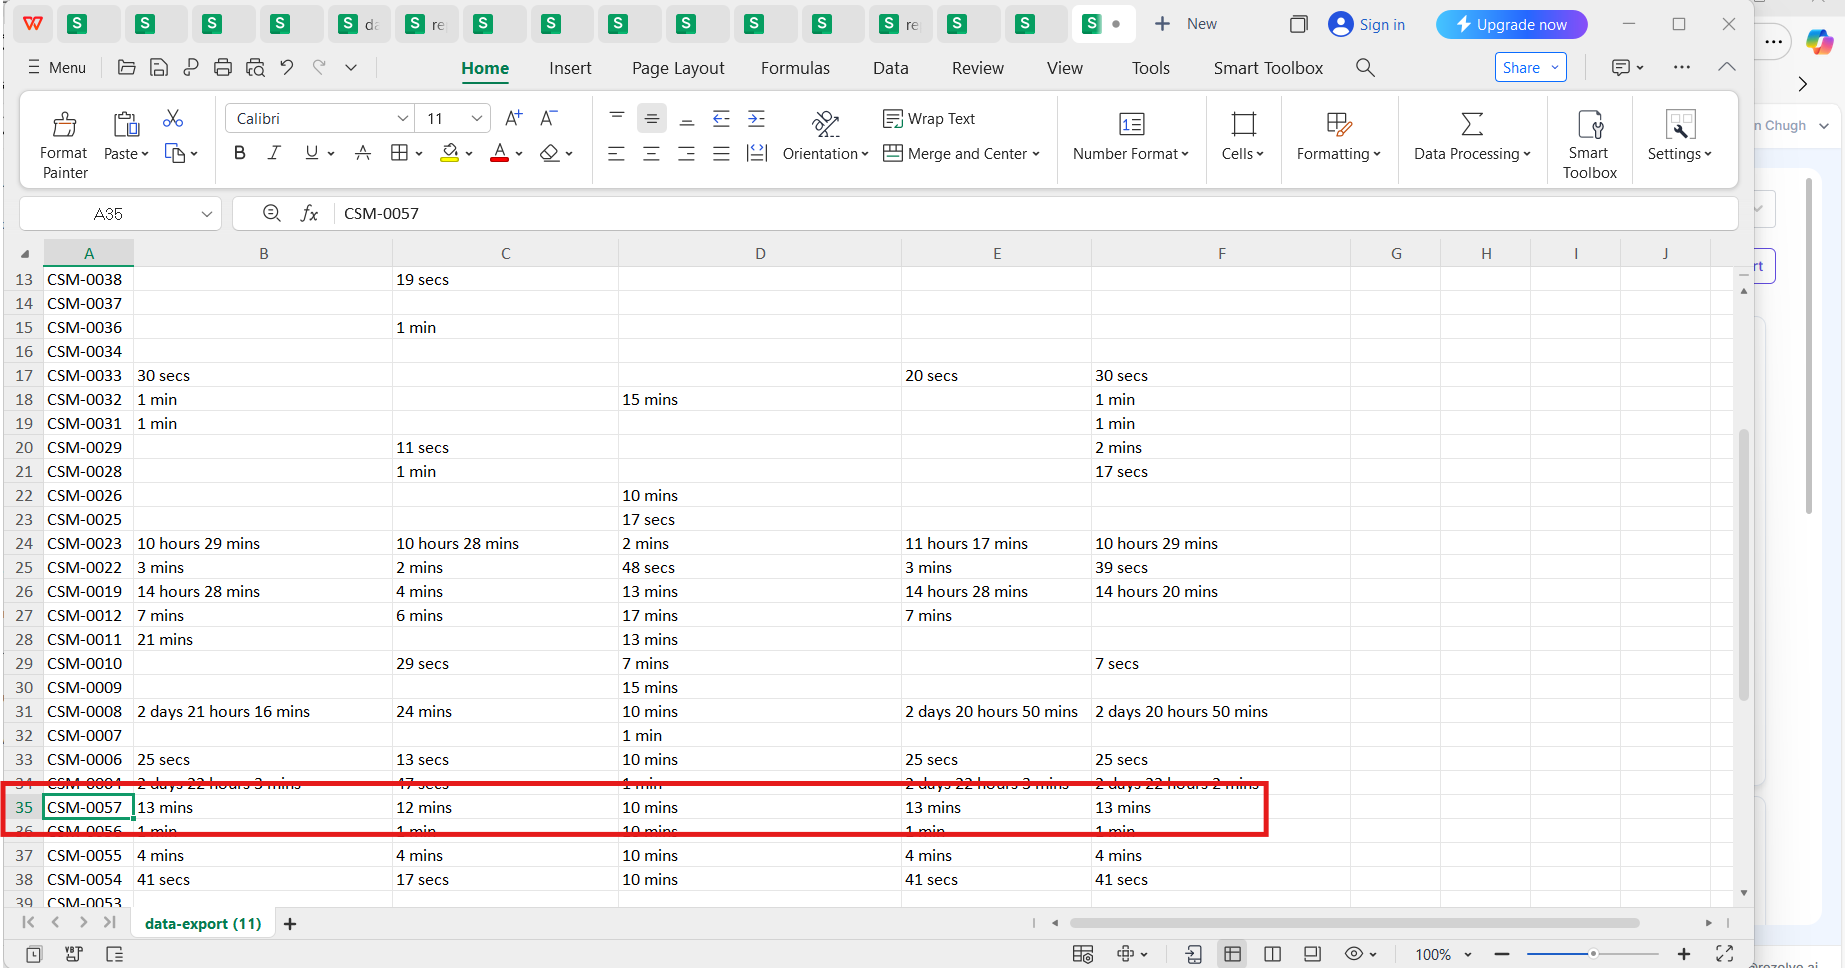
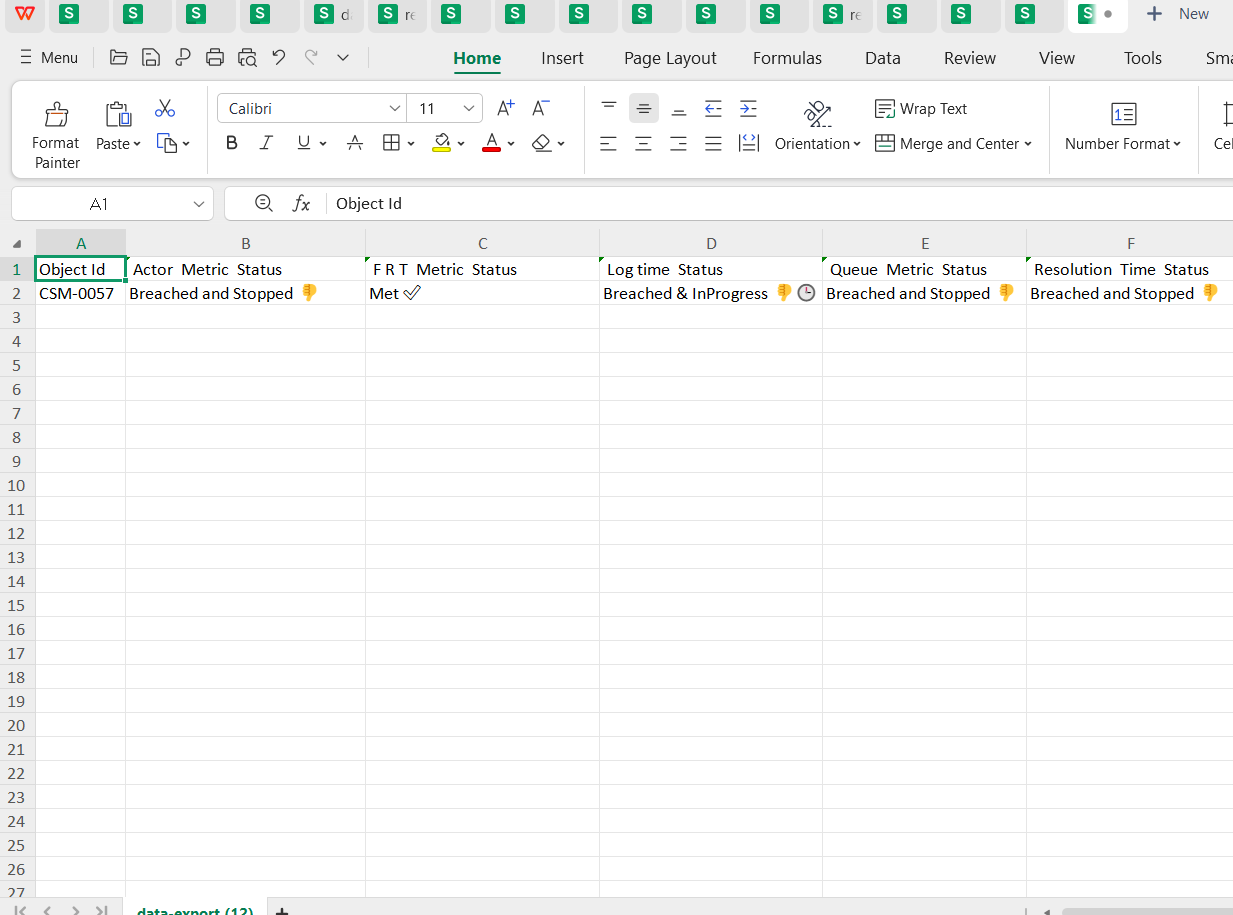
The metric and SLA data should populate in single and multi-dashboard views. The data of metric and the status of SLA on the data warehouse side should be the same as on the agent UI.
Reports
Reports Overview in the System
There are multiple types of reports available for data extraction and automation, categorized across Chart Level, Dashboard Level, and the Reports Section. These reports can be downloaded manually as CSVs or scheduled via subscriptions.
1. Chart-Level Reports
CSV Download:
- Each individual chart in a dashboard offers an option to download its data in CSV format.
- Useful when you want to extract data from a single metric or chart.
Subscription Report:
- You can subscribe to individual charts and receive scheduled reports via email or other channels.
- Ideal for stakeholders tracking specific KPIs regularly.
2. Dashboard-Level Reports
CSV Download:
- Exports the entire dashboard's data in a single CSV file.
- Helpful for a full view of multiple KPIs across a department or module.
Subscription Report:
- Automates dashboard delivery at scheduled intervals to selected recipients.
- Best for recurring executive or operational reports.
3. Reports Section
CSV Report:
- Offers predefined or custom reports that can be manually downloaded.
- Often includes tabular, filterable, or comprehensive datasets.
Subscription Report:
- Allows scheduling of standard reports from the Reports section.
- Commonly used for daily, weekly, or monthly reporting needs across teams.
Data Consistency Requirement
All reports — whether downloaded or subscribed — must reflect the same data for metrics and SLA across:
- Chart View
- Agent UI
- Data Warehouse (DW)
- Reports Section
⚠️ This ensures data reliability and consistency across all reporting channels.
| Report Type | CSV Download | Subscription Available | Data Should Match With |
|---|---|---|---|
| Chart Level | ✅ | ✅ | Agent UI, DW, Reports Section |
| Dashboard Level | ✅ | ✅ | Agent UI, DW, Reports Section |
| Reports Section | ✅ | ✅ | Agent UI, DW, Charts |
Filters Overview Across the System
Filters are provided at multiple levels to allow users to narrow down data based on specific criteria. These filters are consistent across the Chart, Dashboard, and Reports sections.
1. Chart-Level Filters
- Each chart can have individual filters applied, affecting only that chart.
- Metrics and SLA fields will appear in the filter options.
- Data should refresh dynamically based on the applied filters.
2. Dashboard-Level Filters
- Global filters that apply to all charts within a dashboard.
- Metrics and SLA fields are available here as well.
- Applying a filter at this level will reflect across all visual components of the dashboard.
3. Reports Section Filters
- Filters are available when generating or subscribing to reports in the Reports section.
- Users can filter by Metrics, SLA, and other data dimensions before export or scheduling.
- Ensures only relevant data is captured in the downloaded/subscribed report.
Data & Filter Consistency
- Metrics and SLA fields must be consistently present in filter dropdowns across all three levels.
- Data shown in charts, dashboards, and reports should correctly reflect the applied filters.
- There should be no mismatch between the filtered results in UI vs downloaded or subscribed reports.
| Filter Level | Applies To | Metrics/SLA Available | Expected Outcome |
|---|---|---|---|
| Chart-Level | Individual Chart | ✅ | Chart updates with filtered metric/SLA data |
| Dashboard-Level | All Charts in Dashboard | ✅ | Unified view updates across dashboard |
| Reports Section | CSV/Subscription Reports | ✅ | Filtered data appears correctly in output |