Dashboard
The Dashboard is the landing page after login, accessible at /voice. It provides an Operations Overview — a summary of call activity across all Departments.
Period Filter
The period dropdown at the top right (for example, Last 30 Days) sets the time window for every KPI card and chart. The selected date range is shown beside it.
KPI Cards
Each card shows the value for the selected period and the change compared with the previous period of the same length (for example, "+15% vs prior").
| KPI | Description |
|---|---|
| Total Calls | Total number of calls handled. |
| AI Resolved | Calls resolved by the AI. |
| Tickets Created | Calls that resulted in a ticket being created. |
| Transferred | Calls handed off to a human agent. |
| Avg Duration | Average call length, in seconds. |
| Resolution Rate | Percentage of calls resolved by the AI. |
Charts
| Chart | Description |
|---|---|
| Call Volume Trend (Daily) | Number of calls per day across the selected period. |
| Outcome Distribution | Breakdown of calls by outcome. |
| Sentiment Breakdown | Breakdown of calls by caller sentiment. |
| Calls by Department | Share of calls handled by each Department. |
| Avg Duration by Department | Average call length for each Department. |
| Sentiment by Department | Caller sentiment for each Department. |
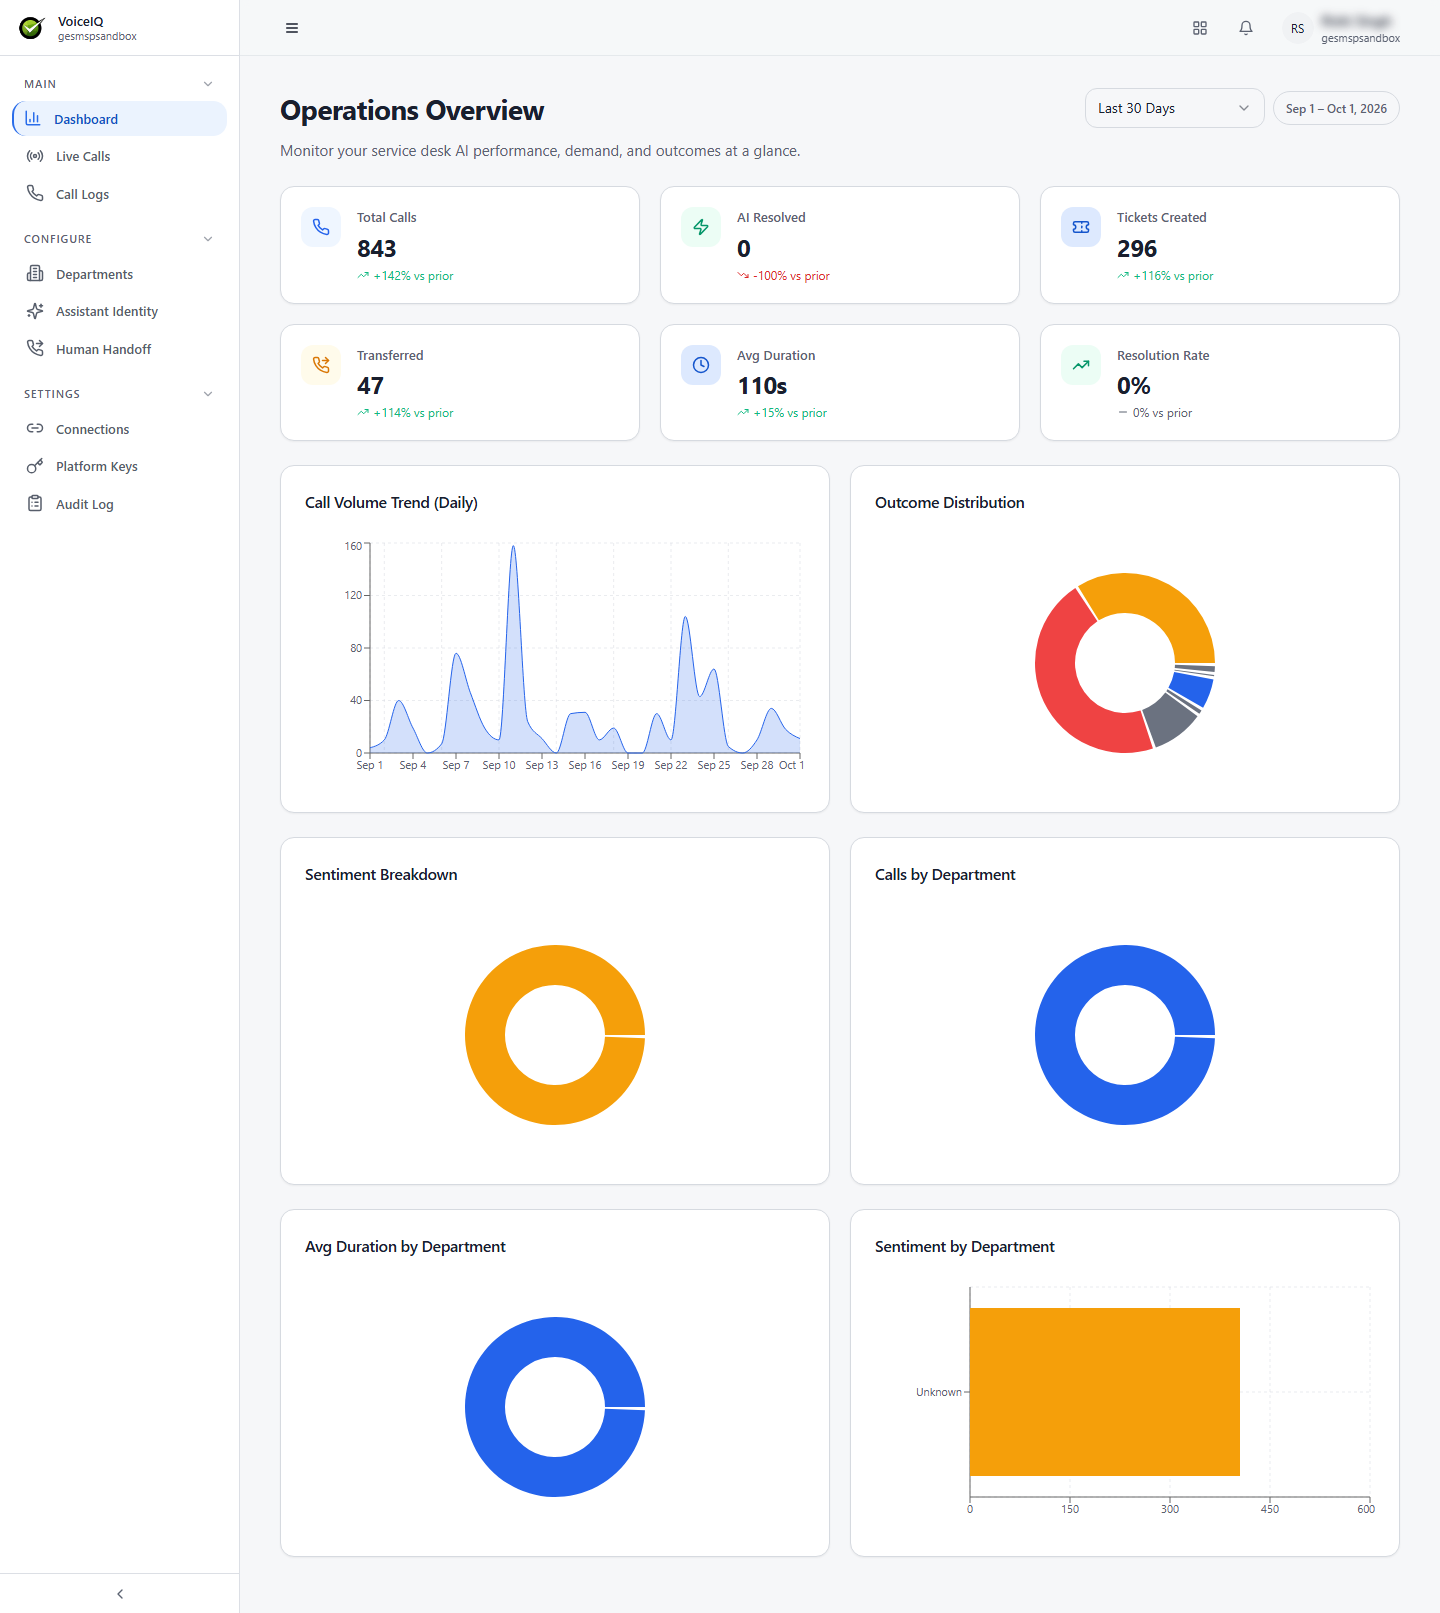
From the dashboard, all main sections of VoiceIQ are accessible via the sidebar: Live Calls, Call Logs, Departments, Assistant Identity, Human Handoff, Connections, and Platform Keys.